November 2, 2022 – This year, the holiday season starts amid a backdrop of moderating job growth, higher interest rates and elevated inflation pressures that are eroding the purchasing power of consumers. Yet despite all the challenges facing American households, spending has held up far better than economic fundamentals would typically suggest. Overall consumer spending rose 8.4 percent year-over-year in the third quarter of 2022, or 2.0 percent after adjusting for inflation.¹ Narrowing the focus to the categories that make up our definition of holiday sales,* spending was up 6.9 percent as of September, suggesting positive momentum going into the holiday shopping season.
2022 U.S. Holiday Spending Outlook
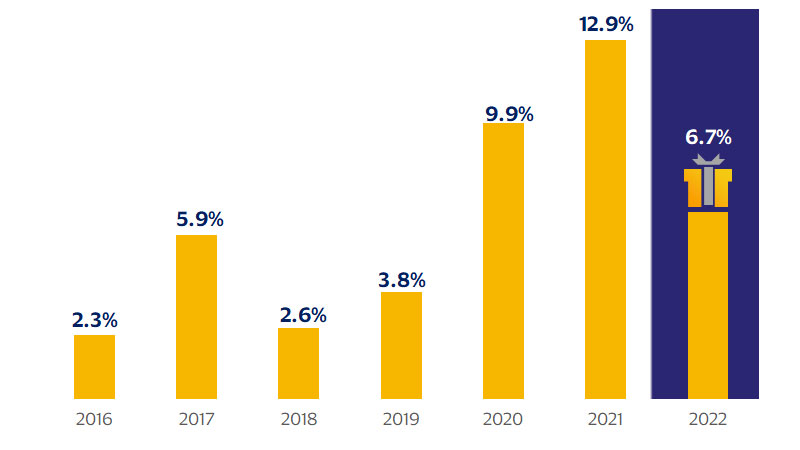
U.S. holiday spending is expected to grow 6.7 percent year-over-year (YoY).


2022 Holiday spending forecast
Amid this backdrop, U.S. holiday spending is expected to grow 6.7 percent year-over-year (YoY) on all forms of payment, according to Visa Business and Economic Insights. While this year’s forecast represents a downshift in sales over last year’s 12.9 percent (YoY) growth, it is still above the 2010-2019 average of 3.7 percent.² Given that holiday sales are not adjusted for inflation, most of the growth in sales this year will likely be attributed to higher prices rather than a sizable uptick in real demand. We see risks to our holiday sales forecast slightly tilted to the downside as the burden of high inflation and softer economic growth could weigh on consumer confidence and, by extension, their desire and ability to spend.
*We define holiday sales as seasonally adjusted nominal retail sales on all forms of payment less sales at automotive dealers, gas stations and restaurants for the months of November and December as reported by the U.S. Department of Commerce.
Holiday retail spending (retail sales excluding autos, gas and restaurants, YoY percent change)
Heading into the 2022 holiday season, there have been some bright spots in the consumer landscape. The unemployment rate reached a multi-decade low in September, sitting at just 3.5 percent. In some states, it fell below 2.5 percent. The economy continues to generate hundreds of thousands of jobs each month, and wages are increasing at the fastest pace in a generation, drawing many people back to the job market.
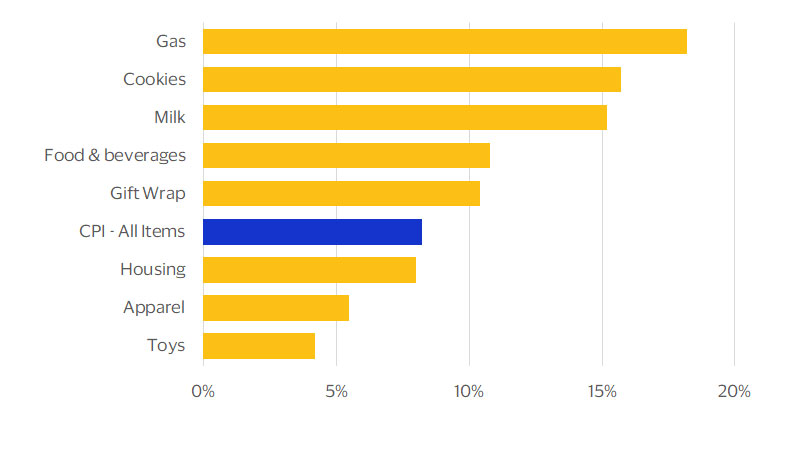
That said, consumer challenges have begun to outweigh the opportunities, and the top issue is inflation. The September Consumer Price Index (CPI) increased by 8.2 percent over the previous 12 months, which is among the fastest surges on record. The cost of everyday essentials has become burdensome, including growth of 8.0 percent for housing, 10.8 percent for food and beverages, and 18.2 percent for gas.
Consumer spending: current state in the U.S.
In response, most consumers have begun to spend less on discretionary categories while prioritizing their core needs, according to the Visa Spending Momentum Index.⁴ Personal income has increased over the last year, but at a slower rate than inflation. Real disposable personal income, which is adjusted for inflation and accounts for taxes, was down by a whopping 2.9 percent as of September. In part, this decline is due to the expiration of federal fiscal support. During last year’s holiday season, a meaningful number of households received Child Tax Credit payments and Pandemic Unemployment Assistance. These programs have ended, or their benefits have been reduced, removing a sizable source of income from some consumers. As such, households are saving less of their monthly incomes and relying more on credit cards and other forms of loans.⁵ All of this has impacted consumer confidence, which has declined steadily throughout 2022.⁶
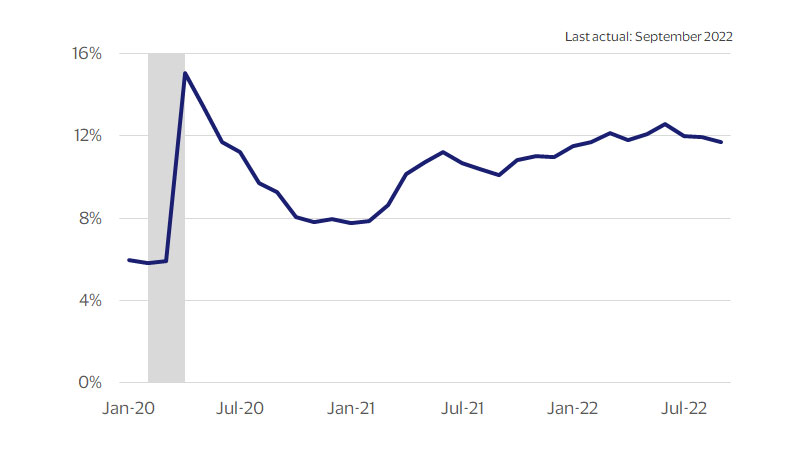
One metric that helps to shed light on expectations for consumer spending is the so-called Misery Index, which combines inflation with the unemployment rate. As of September, the Misery Index had begun to improve but was still higher than almost any point in the last few decades, increasing the chances of lackluster holiday spending.
Misery Index (Consumer Price Index plus the unemployment rate) (SA*, YoY percent change)
Inflation is taking a bite out of consumers’ wallets(CPI SA*, YoY percent change)
Even Santa Claus gets the blues
Economic growth as measured by Gross Domestic Product (GDP) is likely to expand just 0.6 percent in the fourth quarter, but inflation-adjusted consumer spending is expected to rise 1.4 percent relative to the fourth quarter of last year. Inflation is likely to remain high, with consumer prices measured by the PCE Deflator rising 5.7 percent on a YoY basis. Combined, nominal consumer spending should rise 7.2 percent in Q4 as households pivot towards spending more on services and less on goods. Such a trend, which has been unfolding throughout the year, is likely to weigh on the goods-centric holiday sales categories.
Not surprisingly, a large portion of this year’s sales growth will be due to high inflation driving up the nominally reported retail sales numbers. With the CPI above 8 percent and the PCE Deflator rising nearly as fast as holiday sales, the implication is that spending could be relatively flat this season after adjusting for inflation effects, reflecting our outlook for softer economic growth through the end of the year.
How consumers’ gift and e-commerce shopping might change
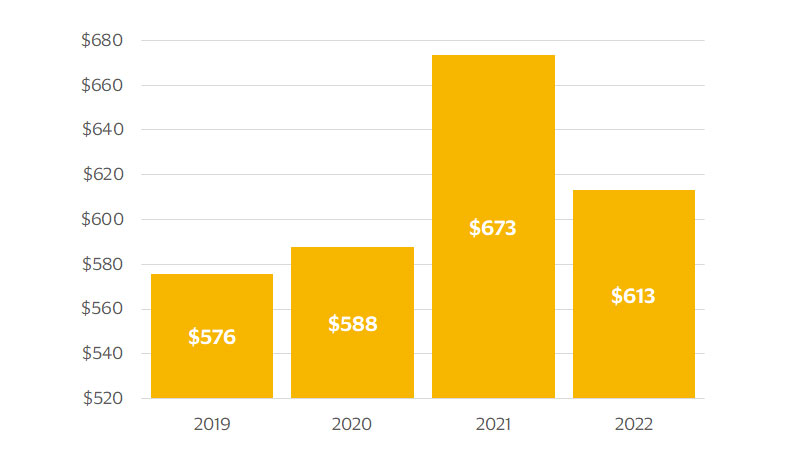
On average, consumers plan to spend $613 on holiday gifts this year, down from $673 last year according to a Visa Business and Economic Insights analysis of survey data from Prosper Analytics and the U.S. Department of Labor.⁷ Lack of confidence in the economy is certainly a factor suppressing consumers’ holiday spending plans. Among those who indicate they have little or no confidence in the economy, the most popular reason for spending less on holiday gifts in 2022 is a lower level of extra income, cited by 67 percent of respondents to the Prosper Analytics survey. Additionally, inflation on non-gift items—cited by 56 percent of those consumers—is a major contributing factor. Despite this reticence, however, the gap of spending intentions between those who remain confident in the economy and those who aren’t isn’t terribly large. Consumers who are confident in the economy only plan to spend 7 percent more than consumers who aren’t.
Average amount consumers plan to spend on gifts this holiday season⁸
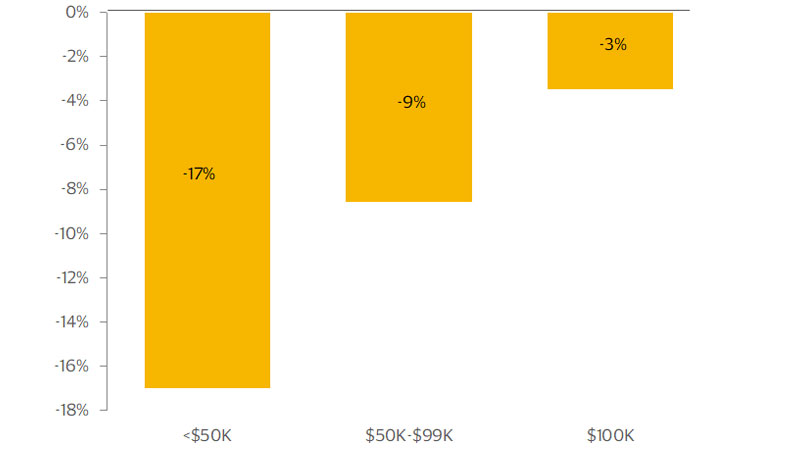
Relative to the 2021 holiday season, spending intentions downshifted across all income groups, with some important differences. Consumers with annual household income under $50,000 say they will spend 17 percent less in 2022 compared to last year, the largest drop recorded in our survey. Despite solid income growth for lower-income consumers throughout 2022, inflation and concerns over the economy could stifle some holiday spending. Middle income consumers expect to reduce their holiday spending by nearly 9 percent, and the most affluent—those with annual household income over $100,000—say they will downshift by just 3.5 percent. Ultimately, these results highlight the bifurcated nature of the consumer in 2022, with non-affluent households under more economic pressure.
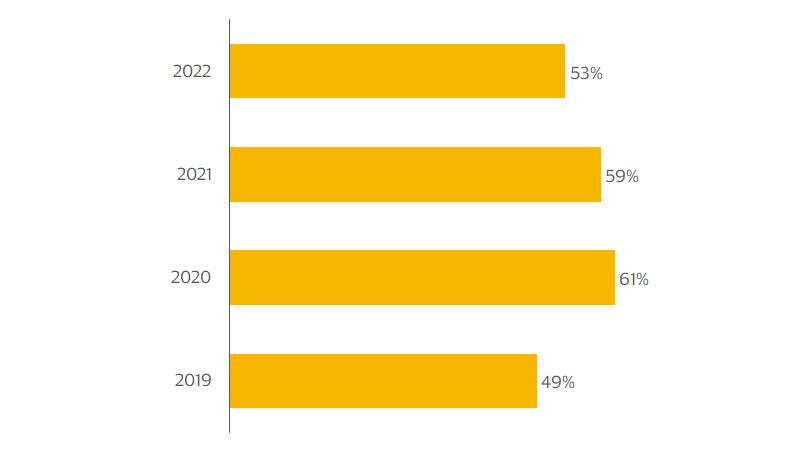
Lackluster expectations also apply to e-commerce, with fewer consumers intending to shop online.⁹ This year, 53 percent plan to do most of their holiday shopping online—down from 59 percent in 2021—while 12 percent expect to avoid e-commerce altogether. These shifts are likely due to an increased comfort with in-person shopping, with far fewer individuals reporting worries about COVID-19. Slightly fewer consumers expect to travel for the holidays this year—27.5 percent as compared to 31.4 percent in 2021—with economic concerns this year supplanting the health concerns from last year. Airfares have risen 43 percent since last year as of September, providing more incentive for holiday staycations as an alternative.¹⁰
Share of consumers planning to shop online for more than half of their holiday needs¹¹
Planned holiday spending by income (YoY percent change)¹²
2022 holiday spending conclusion.
“Holiday who-be what-ee?”
While our 2022 holiday spending outlook appears to be the most likely outcome, the economy is also changing rapidly, adding an unusually high degree of uncertainty to the outlook.The chances of a worse-than-expected season are uncomfortably high. If the labor market weakens substantially in the fourth quarter, consumers would most likely retrench. Under this scenario, holiday spending could lag inflation, leading merchants to sell lower quantities of goods and services than last year. Energy prices could also spike, introducing another hardship for some households. When gas and utility bills go up, gifts are often the first thing cut from the household budget, even during the holidays. Counterintuitively, a competitive discount season could also erode holiday revenue. After two years of supply chain challenges and lean inventories, retailers now have an overhang of products that they apparently want to liquidate. To move this merchandise quickly, they are planning an impressive array of price reductions, with some holiday promotions beginning as early as October. If prices are discounted too steeply, consumers could find serious bargains at the expense of industrywide revenue.
In addition, although COVID-19 is no longer a major driver of consumer behavior, a new winter surge could dampen the holiday spirit, sending people back into their homes and away from stores. Most of the adult population is vaccinated and news coverage of the coronavirus has been seriously reduced, but if we have learned anything from the past few years, it’s to be prepared for the unexpected. On the other hand, U.S. households sit on an exorbitant pile of excess savings—likely totaling more than $500 million¹³—which could fuel a better-than-expected shopping season. This is especially true for affluent households, who have more optimistic outlooks and more funds in the bank.¹⁴ Despite high inflation and pessimistic consumer attitudes, the demand for a jolly experience could still entice consumers to unleash their cash.
References and footnotes
- ¹, ²Visa Business and Economic Insights and U.S. Department of Commerce
- ³Source: Visa Business and Economic Insights, U.S. Department of Commerce
- ⁴Visa Business and Economic Insights and Visa Spending Momentum Index, September 2022, which is based on a sample of aggregated, depersonalized VisaNet and third-party data.
- ⁵Visa Business and Economic Insights, U.S. Department of Commerce, and Federal Reserve Board
- ⁶ Visa Business and Economic Insights and The Conference Board
- ⁷Visa Business and Economic Insights, Prosper Analytics, and U.S. Department of Labor
- ⁸Source: Visa Business and Economic Insights, Prosper Insights & Analytics, U.S. Department of Labor
- ⁹Visa Business and Economic Insights and U.S. Department of Labor
- ¹⁰ Source: Visa Business and Economic Insights, Prosper Insights & Analytics, U.S. Department of Labor
- ¹¹Source: Visa Business and Economic Insights, Prosper Insights & Analytics
- ¹²Source: Visa Business and Economic Insights, Prosper Insights & Analytics
- ¹³Visa Business and Economic Insights and U.S. Department of Commerce
- ¹⁴Visa Business and Economic Insights, The Conference Board, and Federal Reserve Board
Forward-Looking Statements and Disclaimer
This report may contain forward-looking statements within the meaning of the U.S. Private Securities Litigation Reform Act of 1995. These statements are generally identified by words such as “outlook”, “forecast”, “projected”, “could”, “expects”, “will” and other similar expressions. Examples of such forward-looking statements include, but are not limited to, statement we make about Visa’s business, economic outlooks, population expansion and analyses. All statements other than statements of historical fact could be forward-looking statements, which speak only as of the date they are made, are not guarantees of future performance and are subject to certain risks, uncertainties and other factors, many of which are beyond our control and are difficult to predict. We describe risks and uncertainties that could cause actual results to differ materially from those expressed in, or implied by, any of these forward-looking statements in our filings with the Securities and Exchange Commission (SEC). Expect as required by law, we do not intend to update or revise any forward-looking statements as a result of new information, future events or otherwise.
Studies, survey results, research, recommendations, opportunity assessments, claims, etc. (the ‘Statements’) should be considered directional only. The Statements should not be relied upon for marketing, legal, regulatory or other advice. The Statements should be independently evaluated in light of your specific business needs and any applicable laws and regulations. Visa is not responsible for your use of the Statements, including errors of any kind, or any assumptions or conclusions you might draw from their use.