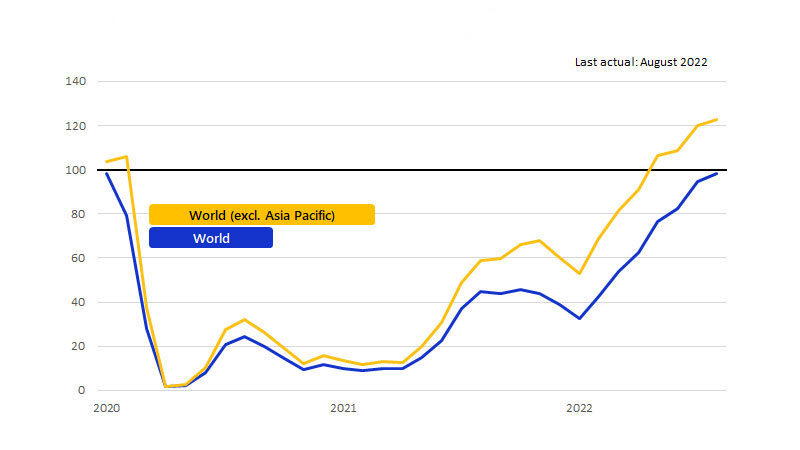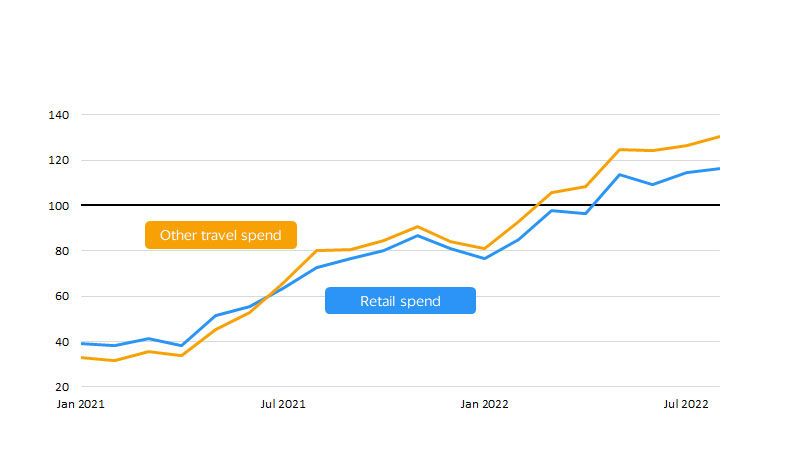
November 2022 – Global travelers have quickly moved on from the pandemic. International arrivals in 2022 are well on their way to reaching 850-900 million by the end of the year, accounting for 75-80 percent of the 2019 levels, according to the Visa International Travel (VISIT) platform.¹ Not only are tourists crossing borders in greater numbers, but their spending while abroad has also matched the recovery, even at shops and other retail outlets. Retail tourism spend has tracked—and in some cases surpassed—2019 levels.
Against this generally positive momentum, international travel is once again at a crossroads. One path could lead the world to a full recovery in 2023: the full lifting of all remaining health-related border restrictions—especially in Asia Pacific—would provide a welcome boost. The other path could drag on the recovery as demand from North America and Europe weakens, leaving global travel slightly short of a full recovery. No matter which path is taken, trends established over the first nine months of 2022 set the stage for growth in the global travel and tourism industry to move more broadly forward.
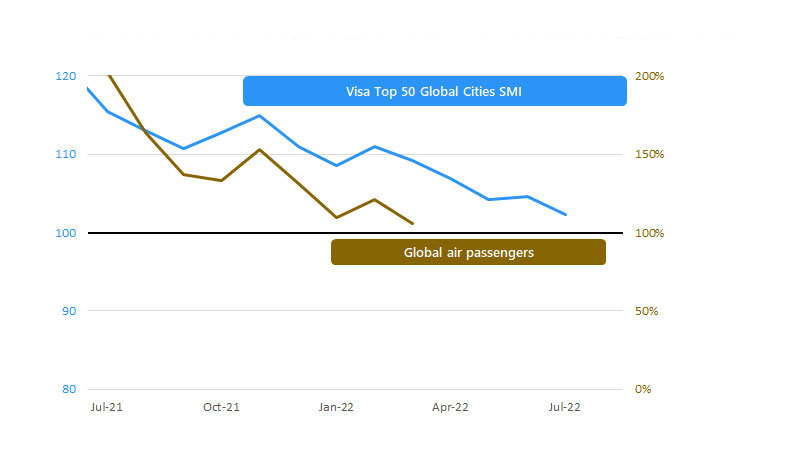
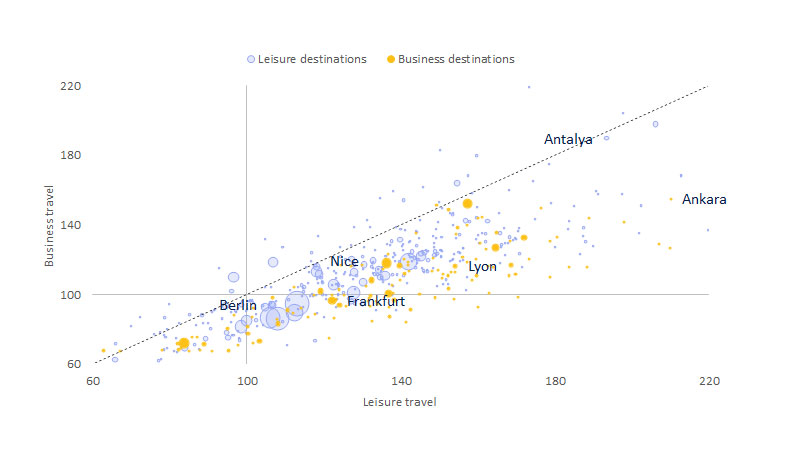
In an unexpected and welcome twist, cross-border leisure travel’s recovery may be preparing the way for a potential rebound in business travel. Although business travel generally lags leisure’s recovery, destinations that once mainly attracted business travelers have not been left far behind. In these destinations, leisure travelers have filled the gap left by their business counterparts, helping to even out the recovery in travel across cities and to bring back the infrastructure needed to support the eventual return of business travel.