Sept 11, 2019 – In this month’s update, we extend our forecast horizon through the end of 2021. Thematically, growth is expected to begin downshifting but remain positive heading into 2020 and beyond. Ongoing trade tensions will likely remain unresolved over the forecast horizon and thus weigh on global growth. Soft global growth could have three main effects on the U.S. economy. First, continued pressure on export activity along with modest domestic demand, translating into slower growth from net exports. Second, weakness in the manufacturing sector for the foreseeable future that holds back business fixed investment. Finally, foreign capital inflows into the U.S., likely keeping longer-term interest rates lower and the dollar stable over the coming quarters.
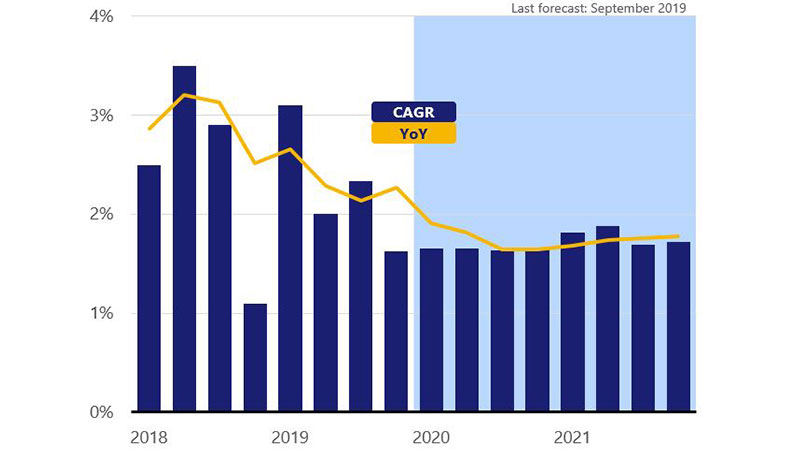
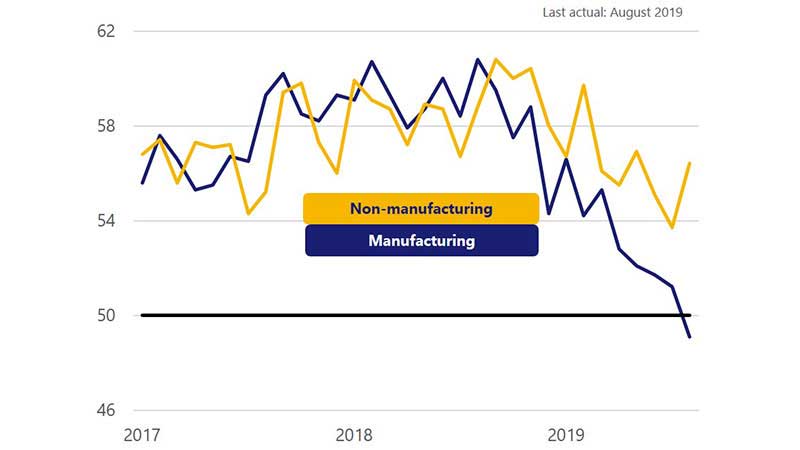
The result will be a continuation of the tale of two economies, with manufacturing struggling while the services side of the economy continues to expand. Overall, the slow global growth and trade-related headwinds combine to push growth below 2 percent in 2020, with a further deceleration in 2021. The U.S. consumer will be the key support to growth over the next couple of years as fundamentals such as job growth and wage gains still support modest real consumption growth between 2.0-2.5 percent.