June 15, 2021 – The U.S. economy is still recovering from a short, but very sharp recession in early 2020. Unlike previous recessions, this downturn was not caused by a breakdown in a particular industry, but a widespread shock that rippled through the entire economy, with some industries hit much harder than others. While the effects of this recession were felt nationwide, the depth of the downturn and pace of the recovery have diverged significantly by state. This has large implications for issuers and merchants, since their regional footprints will determine how quickly they can expect their businesses to recover.
According to our analysis, states with lower restrictions and higher employment in essential industries (i.e. construction and manufacturing) have had the lowest gross domestic product (GDP) and employment declines caused by the pandemic:
- The East South Central and Mountain West census divisions have been the quickest to recover, as these areas include states that have, in general, higher employment in essential industries. Their lockdown policies were also less strict during the pandemic than the rest of the nation.
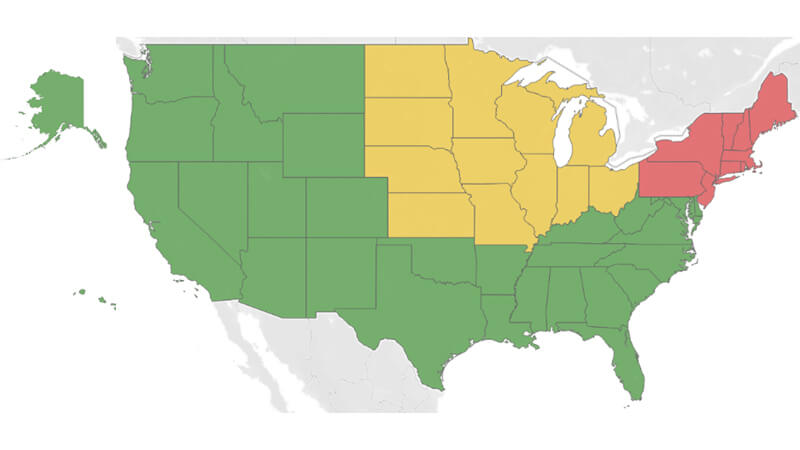
- Our forecasts suggest the South will recover the quickest to the pre-pandemic level of gross state product (GSP) (map above), while the Northeast will recover the slowest due to higher restrictions and greater dependence on non-essential industries.