February 28, 2022 – Last year’s global consumer spending boom should echo through this year, leading to another solid year of economic growth. After reaching a multi-decade high of 5.8 percent, real global economic growth is set to slow to 4.2 percent in 2022. Even at this lower pace, global growth will still be a percentage point higher than its average over the last decade.
Governments and central banks’ decisive actions to soften the blow to household finances during the 2020 lockdowns enabled the rapid rebound in 2021. Lifting of health restrictions and widespread vaccination led to the release of pent-up demand in advanced economies. Although the easy gains are now largely past, timely government support had the additional benefit of preventing lasting damage to labor markets and bolstering household finances.
Globally, nearly two-thirds of the jobs lost to the pandemic have already been regained,¹ and worldwide employment should surpass 2019 levels in 2022. Additionally, savings built up during the crisis remain available to further support spending going forward.² Together, these developments are now setting the stage for growth to remain elevated in 2022.
In any other time, the swiftness of the recovery would be welcome, in particular the record number of job openings spread across advanced economies at the start of a sustained synchronized cyclical upswing. However, just as past pandemics have proved to be only partial guides to understanding COVID-19’s trajectory,³ trends from previous global business cycles can only take us so far in anticipating what comes next. The unevenness of the recovery stretches the performance of models used to forecast economics and in business planning. Now more than ever, careful reading of the forces shaping key economic variables in the present, especially those related to the pandemic, are critical.
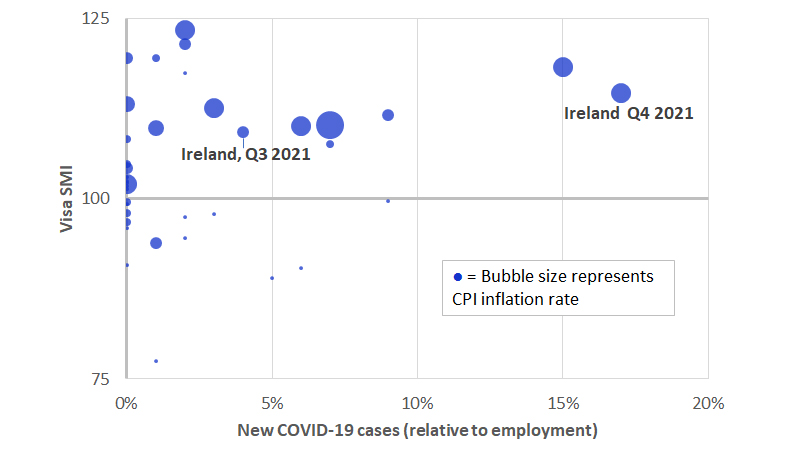
Traditional models of inflation, for example, do not incorporate the impact of infection, but maybe until the pandemic is over they should. Early in the pandemic, lockdowns imposed to slow the spread of the disease reduced spending and output at the same time. More recently, given medical advances, lockdowns generally have been more targeted and spending more resilient to the outbreaks. On the other hand, each outbreak now leads to more people getting sick and increases the probability of disrupting business as workers call in sick or are forced to quarantine.
On a global scale, differences in countries’ approaches to controlling outbreaks means that supply could be constrained in a key exporter—while demand remains robust in its key export markets—leading to shortages and rising prices. Across six markets tracked by the Visa Spending Momentum Index, each new infection per 10 workers on average resulted in one percentage point higher price inflation—a measure of the virus’ restraining effect on the productive capacity of the economy.
