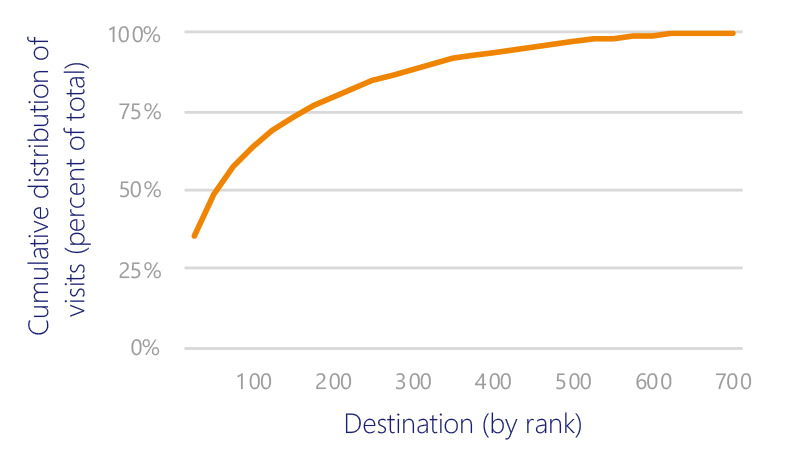
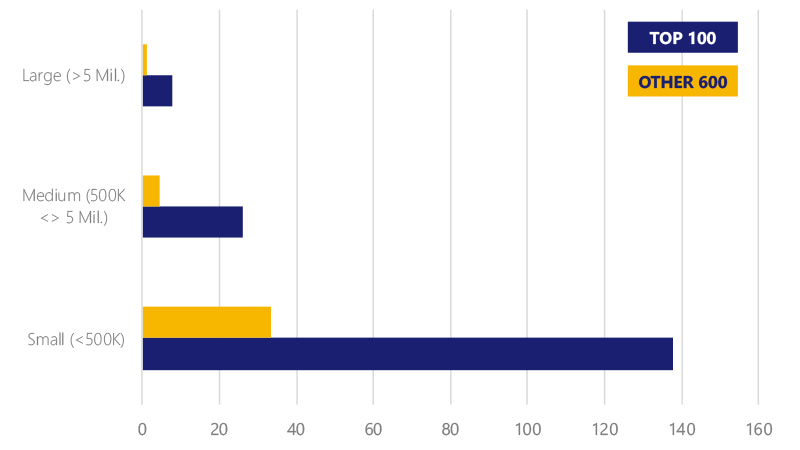
September 5, 2019 – In 2018, the total number of cross-border tourist arrivals rose by 74 million¹ to reach a new high of 1.4 billion. Put into perspective, that growth represents an outbound travel market equivalent to nearly all outbound U.S. travel last year. It was the second year in a row for such an increase. While the number of people traveling abroad is increasing rapidly, where these globe trekkers are going is not. According to Visa data,² 94 of the top 100 most internationally-visited destinations in 2018 were also in the top 100 in each of the past four years. Familiar names such as Paris, Bangkok and Hong Kong were as likely to enjoy this distinction as were Marrakesh and Warsaw. In each of the past four years, these top 100 places consistently accounted for two-thirds of all international travel.
Is this surging demand causing “overtourism” in the most popular global destinations? One of the top-trending buzz terms in the travel industry this year, overtourism essentially describes destinations that are stretched beyond their ability to host the current and growing volume of tourist arrivals. The strong growth in global tourism, especially in thinly-populated destinations, has played a role, as has the narrow set of places that world travelers visit. Most of the overtourism analysis consists of individual anecdotes, but with very little data to back them up. Visa’s international travel (VISIT) platform can provide context and insights on the impact of outbound travel trends on over 700 destinations around the world.
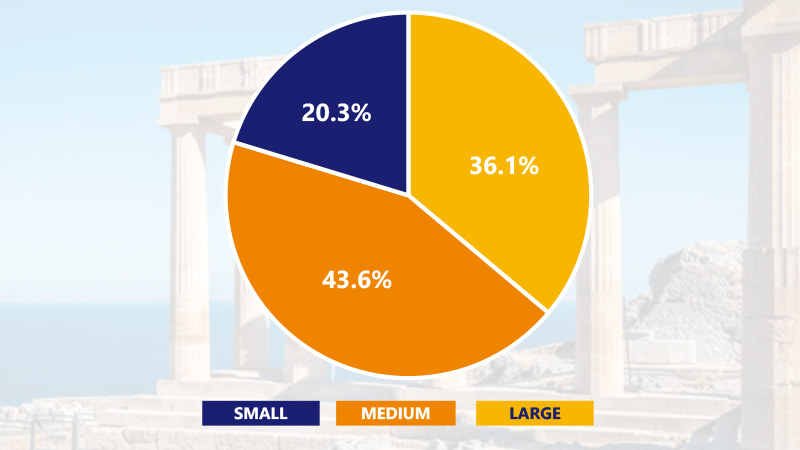
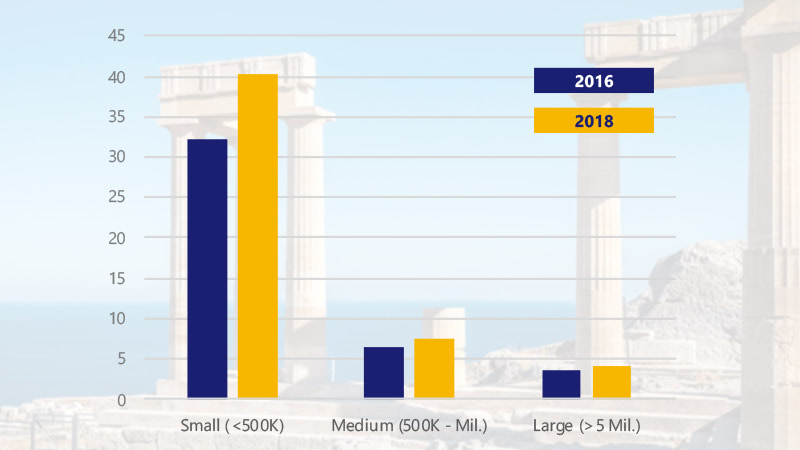
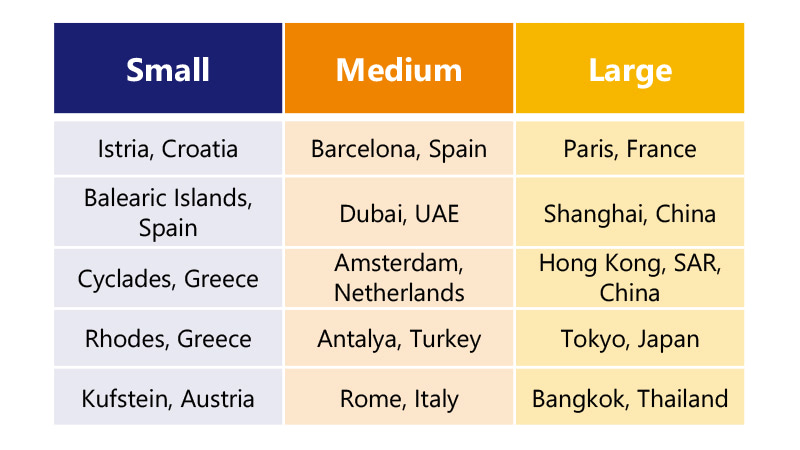
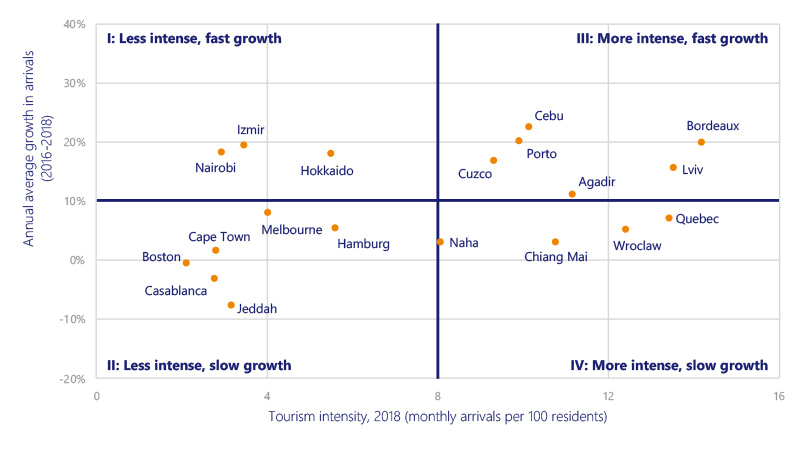
By combining VISIT’s arrival data with data on the size of the resident population, tourism intensity can be measured more systematically across the world. Tourism intensity, the number of tourists relative to the resident population of a destination, provides one measure of the impact of foreign travelers on destinations.³ One challenge for the industry is that the increase in tourism to destinations around the world is more acutely felt by less populated areas. Although small destinations (those with less than 500,000 full-time residents) accounted for only a quarter of the travel over the past two years, they faced the greatest impact as measured by the intensity of tourism. Unlike large cities, small towns may not have the same level of infrastructure to support large numbers of visitors, so the increase in tourism could lead to greater, more visible, congestion.
