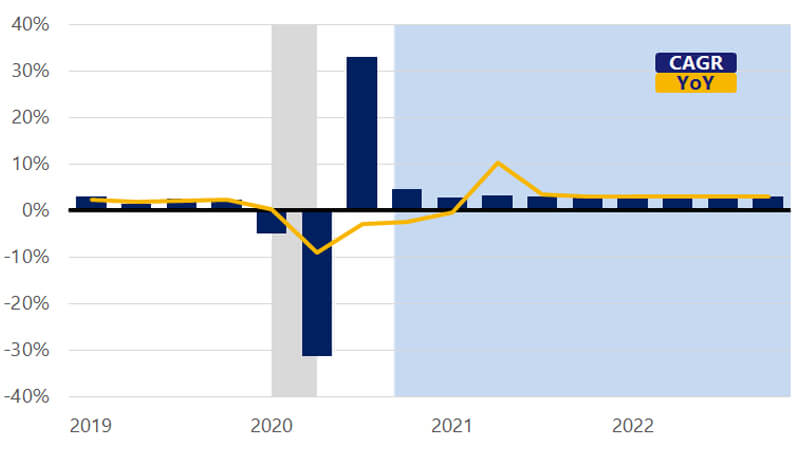
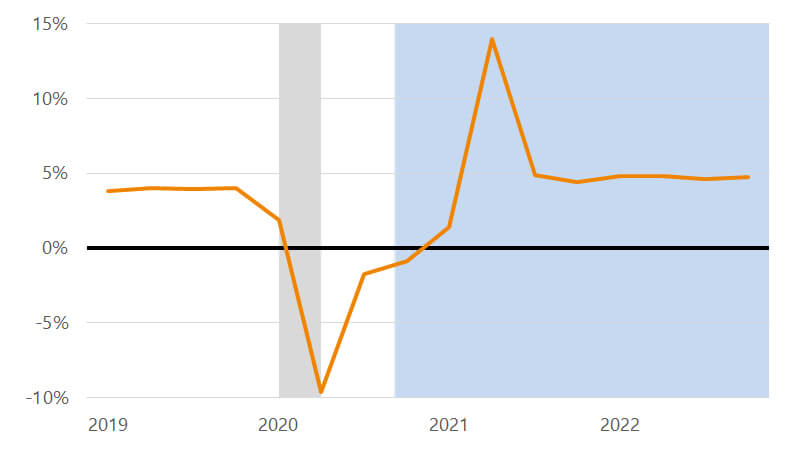
December 15, 2020 – As we approach the end of 2020, many of us are eager to turn the page and focus on the year ahead, optimistic that the next year will be better than the last. This report represents the collective views of our U.S. economics team and our department’s first U.S. Annual Economic Outlook. We take a step back from the quarterly variations in gross domestic product (GDP) growth or consumer spending and focus on the key themes that will determine economic growth in the year ahead.
Next year will be a tale of two halves, with surges in COVID-19 cases marking the first half, eroding consumer confidence and slowing aggregate economic activity. The second half of the year will likely reflect the gradual containment of the virus through more widespread vaccine adoption and increased confidence in hard-hit areas of consumer spending, such as travel and dining out. Consumers’ confidence in re-engaging more broadly in spending will be critical to the path of the consumer spending recovery over the next 12 months. The re-emergence of inflation is one potential headwind to consumption growth; it will help to lift nominal spending, but also reduces inflation-adjusted disposable income. We expect the Federal Reserve to look past the emerging inflation pressures and keep short-term interest rates and their bond-buying program (known as quantitative easing) unchanged throughout next year.
The new Biden administration is likely to face a divided Congress next year, which will make major fiscal policy changes, outside of another round of stimulus, less likely. Both fiscal and monetary policy will move to the back burner. The low rate environment and the Fed’s bond buying program will help to keep a lid on mortgage rates while the pandemic continues to reshape consumer perceptions of how and where they live. Both trends will help boost residential construction next year, providing a bright spot of growth. Conversely, nonresidential construction (commercial real estate) will not benefit much from the stability in economic fundamentals in the second half of next year as firms rethink the mix of in-person and remote work and manage risk for the long-term.
As a result, a sizable downshift in nonresidential investment in the year ahead will likely offset the positive effects of residential investment. Our December economic forecast (see last page of the linked report below) reflects these key themes and represents our informed point-of-view regarding the future path of economic growth. We remain humbled by the events of 2020 and recognize the larger than normal error bands around our outlook. As we await the events of 2021, we stand ready to continue assessing key developments in the economy as they unfold and keeping our readers and clients informed along the way. We wish you all the best in the year ahead.

