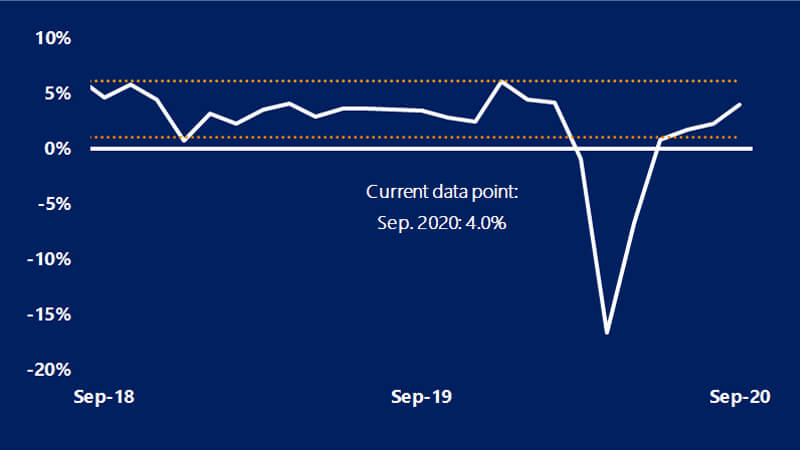
November 10, 2020 — Retail sales (excluding auto sales) rose 1.5 percentage points from August’s level of sales and are now 4 percent above last year’s September levels. This year-over-year (YoY) growth was just 0.12 percentage points lower than in February of this year, as back to school, home improvement, and furniture sales provided a much-needed boost to September retail sales. Wage and salary growth improved across sectors in August. However, unemployment claims remained high in August as federal unemployment boost payments were cut in half, which reduced disposable income growth by 4.1 percentage points from July to August. The savings rate declined to 14.1 percent of disposable income in August as a result of the reduction in federal assistance and recovering retail sales.
U.S. consumer activity accelerated in September
Fewer than one million jobs added—first time since start of recovery
Consumer prices rose for the third consecutive month, finishing September at 1.4 percent on a YoY basis. Overall consumer confidence was revised upward from 84.8 to 86.3 in August. In September, consumer confidence jumped 15.5 points, finishing above 100 for the first time since March. While August’s job gain was revised up to 1.49 million from the originally reported 1.37 million jobs, there were only 661,000 new jobs added in September. This was less than half of the jobs added in any month since the recovery began in May. The labor market remains 10.7 million jobs below the pre-COVID peak in February. The unemployment rate decreased 0.5 percentage points in September, finishing the month at 7.9 percent.
"The September bounce in retail sales along with a higher consumer confidence reading was welcome news on the health of consumers,” said Michael Brown, Principal U.S. Economist. “Personal spending remains soft, however, as most consumers spend on goods rather than services. The recovery in overall consumer spending continues to be gradual."
"Rising consumer prices and confidence in September provided a positive indication that the consumer continues to recover following the recession,” said Travis Clark, Associate U.S. Economist. “Job growth continued to slow in September, a trend that could threaten the strength of the recovery and consumer spending."
Highlights:
- Nominal consumer spending remains 1.9 percent below last year’s level
- Durable goods purchases slowed considerably, while spending on services was slightly better
- Growth in consumer confidence was much more pronounced among those 35 and older than those under 35
Retail sales excluding auto sales (YoY percent change)

Sources: Visa Business and Economic Insights and U.S. Department of Commerce.
Forward-Looking Statements
This report contains forward-looking statements within the meaning of the U.S. Private Securities Litigation Reform Act of 1995. These statements are generally identified by words such as “outlook,” “forecast,” “projected,” “could,” “expects,” “will” and other similar expressions. Examples of such forward-looking statements include, but are not limited to, statements we make about Visa’s business, economic outlooks, population expansion and analyses. All statements other than statements of historical fact could be forward-looking statements, which speak only as of the date they are made, are not guarantees of future performance and are subject to certain risks, uncertainties and other factors, many of which are beyond our control and are difficult to predict. We describe risks and uncertainties that could cause actual results to differ materially from those expressed in, or implied by, any of these forward-looking statements in our filings with the U.S. Securities and Exchange Commission. Except as required by law, we do not intend to update or revise any forward-looking statements as a result of new information, future events or otherwise.
Disclaimer
Studies, survey results, research, recommendations, opportunity assessments, claims, etc. (the ‘Statements’) should be considered directional only. The Statements should not be relied upon for marketing, legal, regulatory or other advice. The Statements should be independently evaluated in light of your specific business needs and any applicable laws and regulations. Visa is not responsible for your use of the Statements, including errors of any kind, or any assumptions or conclusions you might draw from their use.