Canada’s solitary revolution: Rise of single-person households creates business opportunities

June 2023 – Over the past few decades, the number of single-person households around the world has risen significantly. This trend is particularly prominent in developed countries such as the U.S. and Canada, where the number of people living alone has increased substantially. According to the United Nations, the proportion of single-person households worldwide increased from 23 percent in 1985 to 28 percent in 2018. By 2050, this number is projected to reach 35 percent.
In Canada, single-person households are the fastest growing household segment, representing one-third of all households and shaping the future of household development. This trend presents new opportunities for businesses to provide products and services tailored to the needs and preferences of this demographic, such as smaller portion sizes, convenient and affordable delivery options, and personalized experiences.
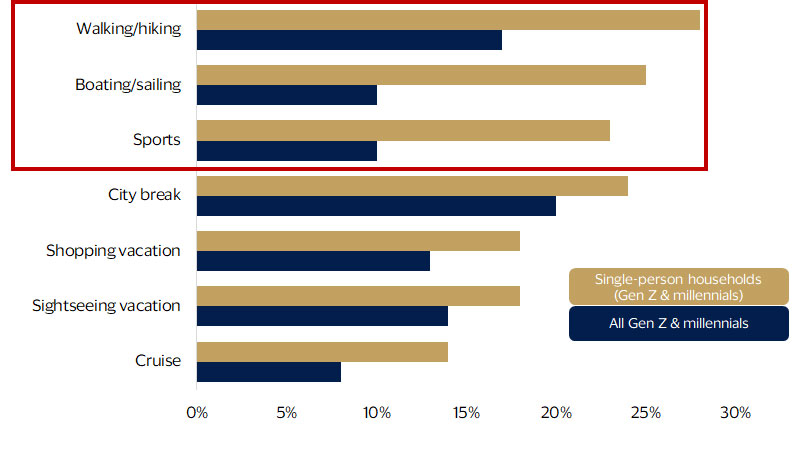
By actively managing their budgets and spend, single-person households have more purchasing power. They also tend to socialize and spend more time outside than traditional families. This makes them more likely to eat out than cook at home, more likely to take on physically active travel such as hiking or skiing, and more likely to choose low maintenance housing such as condominiums or townhouses in an urban environment.
Vacation type preferences among Gen Z and millennials, by household type
Growing prevalence of the one-person household
Several factors have contributed to the rise of single-person households. Changing social norms and cultural values have made it more socially acceptable for people to live alone, particularly in Western societies. Moreover, there has been a rise in individualism and a decline in the importance of traditional family structures.
Growing demographic trend: Another significant factor is the rise of women in the workforce. In the U.S., women make up 58 percent of all one-person households; in Canada, they make up 62 percent. As women have become more financially independent, they are more likely to live alone and may delay marriage and having children. Divorce rates have also increased.
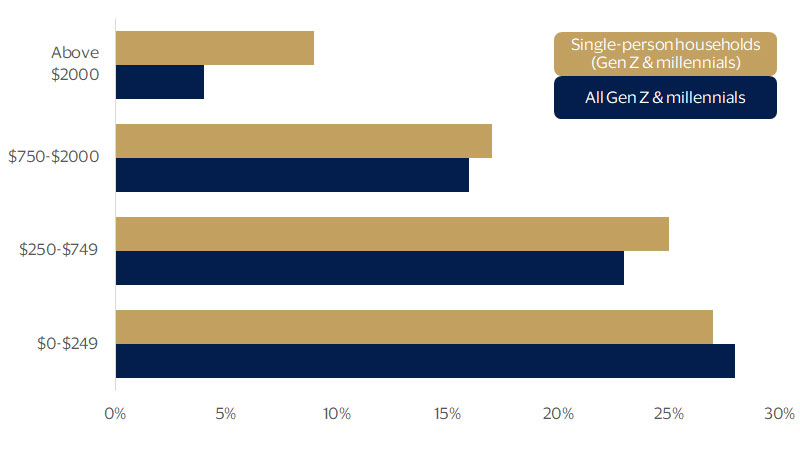
Economic influence: Individuals who live alone often have higher discretionary income than those in the same age group living in larger households. With fewer financial responsibilities and greater control over their finances, individuals living alone have the ability to allocate a greater portion of their income towards discretionary spending. This economic influence makes them an attractive target market for businesses across various industries, including retail, entertainment, dining, and travel.
Shift in consumer preferences: Single-person households have distinct preferences and seek convenience, tailored experiences, and products/services that align with their individual lifestyles, creating opportunities for specialized offerings.
Digital connectivity: Single-person households are highly connected digitally, presenting opportunities for businesses to engage with them through targeted digital marketing, e-commerce platforms and mobile applications.
Monthly discretionary income among Gen Z and millennials, by household type
Single-person households are a force in Canada
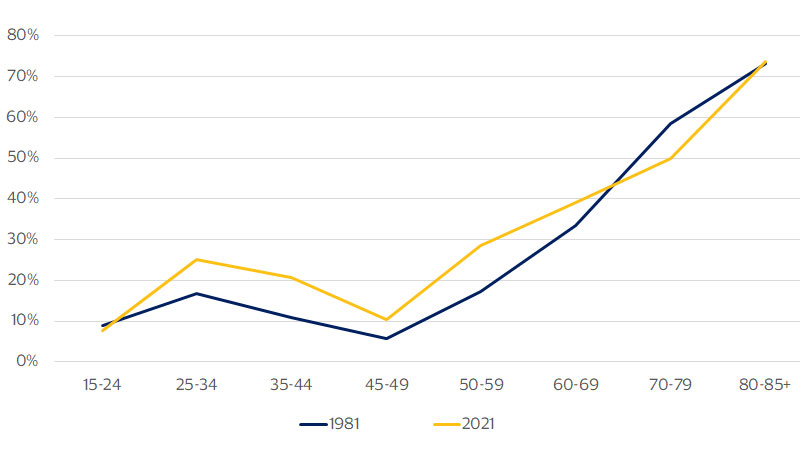
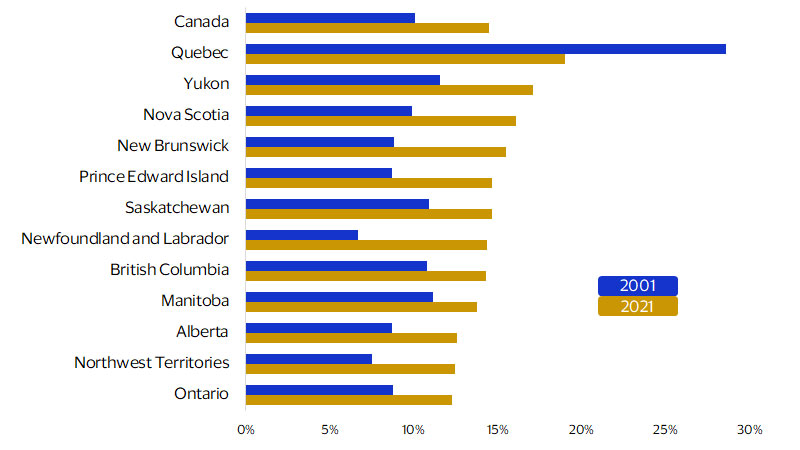
In Canada, the rise of single-person households has been particularly pronounced. The percentage of one-person households grew from 13 percent in 1961 to 29 percent (or 5.9 million households) in 2023, according to Statistics Canada and YouGov. This trend is expected to continue, with an estimated 40 percent of all households in Canada expected to be single-person households by 2041. Also, every province and territory experienced growth.
Single-person households have changed the way people live, work, and interact with each other. They tend to spend less on household goods and services, which can impact consumer demand and business models. In both the U.S. and Canada, the rise of single-person households has led to an increase in demand for rental housing. As of April 2023, single-person households accounted for 40 percent of rental households in the U.S. and 58 percent in Canada. They also tend to require smaller living spaces, which can impact the real estate market and has implications for transportation and other public services. For example, smaller living spaces and a preference for urban areas can impact demand for public transportation and infrastructure that supports pedestrians and cyclists. Additionally, Canada’s aging population means that the number of single-person households is likely to continue to rise, which may have implications for healthcare and social services.
Single-person households spend a higher proportion of their income on clothes, food, restaurants, leisure and entertainment. They also tend to be more risk-tolerant, less price-conscious, more brand-focused, and drawn to convenience when it comes to consumption and buying. The combination of these characteristics is expected to affect markets in the coming years in a fundamental way.
Percent of persons aged 15 and older that are living alone in private households
Share of adults living alone by province and territory
Impact is here and now: Brands are already catering to single-person households
Over the past few decades, the rise of single-person households has been a notable global trend. The increase in the percentage of single-person households has implications for society, the economy, and customer relationships. The emergence of new types of communities and changes in demand for housing, transportation, and public services are among the outcomes of this trend.
In response, certain industries and companies are adapting to meet the needs of this segment. For instance, P&G has introduced a larger toilet paper roll called the Forever Roll, which lasts for a month and caters to singles living in small spaces with limited storage. Similarly, Arnold, an American bread brand, offers 10-slice loaves for individuals who live alone and want to avoid food waste. Home appliance companies, such as Bosch, are also reducing the size of their appliances to accommodate small homes and apartments. These smaller versions of high-performance appliances are otherwise no different from their larger counterparts.
While these consumers may prefer to live alone, they still value companionship outside their homes. Brands like SoloTraveller have created apps for single travelers to connect with like-minded individuals who want to travel safely and share their experiences. OpenTable, a restaurant reservation platform, has created a dedicated app for solo diners in Virginia called “Open Seat.” It pairs singles who do not want to dine alone with other solo diners or groups.
The architecture and home design industries were among the first to recognize the growing potential of the single-person household trend and have started creating small living spaces to cater to them. The Dwell on Design Conference saw architects and designers showcasing plans for micro-apartments that they believe will house an increasing number of individuals living alone in cities in the future. Additionally, several food companies like Kellogg’s, Bisto, and Tabasco have introduced single-serving products to target households with individuals living alone.
Forward-Looking Statements
This report may contain forward-looking statements within the meaning of the U.S. Private Securities Litigation Reform Art of 1995. These statements are generally identified by words such as “outlook”, “forecast”, “projected”, “could”, “expects”, “will” and other similar expressions. Examples of such forward-looking statements include, but are not limited to, statement we make about Visa’s business, economic outlooks, population expansion and analyses. All statements other than statements of historical fact could be forward-looking statements, which speak only as of the date they are made, are not guarantees of future performance and are subject to certain risks, uncertainties and other factors, many of which are beyond our control and are difficult to predict. We describe risks and uncertainties that could cause actual results to differ materially from those expressed in, or implied by, any of these forward-looking statements in our filings with the SEC. Expect as required by law, we do not intend to update or revise any forward-looking statements as a result of new information, future events or otherwise.
Disclaimer
The views, opinions, and/or estimates, as the case may be (“views”), expressed herein are those of the Visa Business and Economic Insights team and do not necessarily reflect those of Visa executive management or other Visa employees and affiliates. This presentation and content, including estimated economic forecasts, statistics, and indexes are intended for informational purposes only and should not be relied upon for operational, marketing, legal, technical, tax, financial or other advice and do not in any way reflect actual or forecasted Visa operational or financial performance. Visa neither makes any warranty or representation as to the completeness or accuracy of the views contained herein, nor assumes any liability or responsibility that may result from reliance on such views. These views are often based on current market conditions and are subject to change without notice.
Visa’s team of economists provide business and economic insights with up-to-date analysis on the latest trends in consumer spending and payments. Sign up today to receive their regular updates automatically via email.