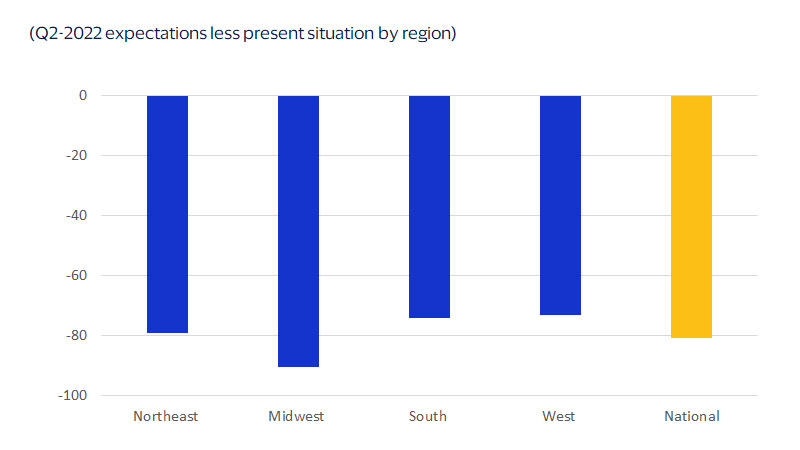
August 2022 – The short-term outlook is largely positive for all regions of the U.S., but the longer-term view has become far more uncertain. When consumers’ confidence about the future falls considerably below their assessment of present conditions, it signals that economic growth is likely to decelerate. While we do not expect a recession within the next 12 months, we have downgraded our forecast for gross domestic product (GDP) in the second half of 2022 significantly across all regions due to a sharp contraction in residential investment, declining business investment and persistent inflation that will continue to erode real (inflation-adjusted) consumer spending.
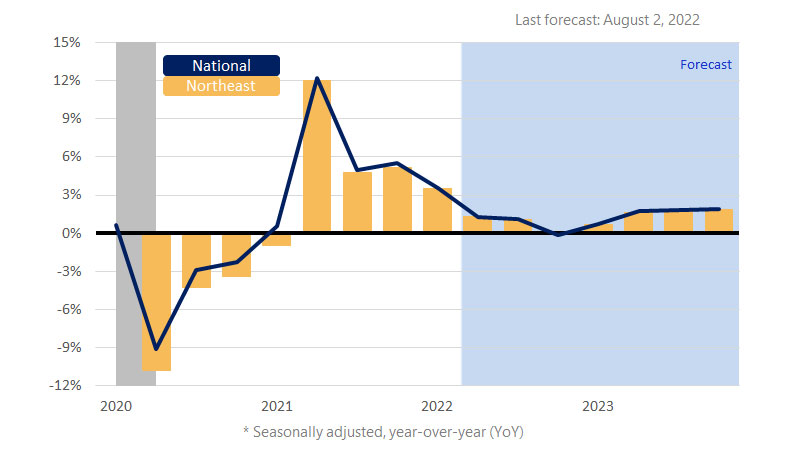
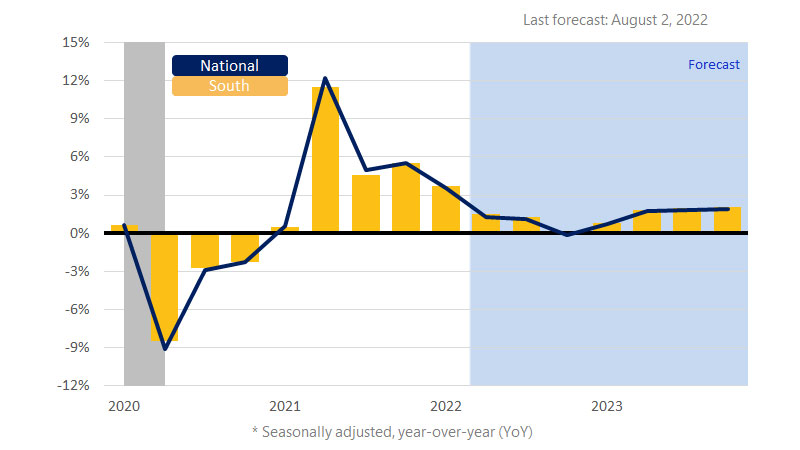
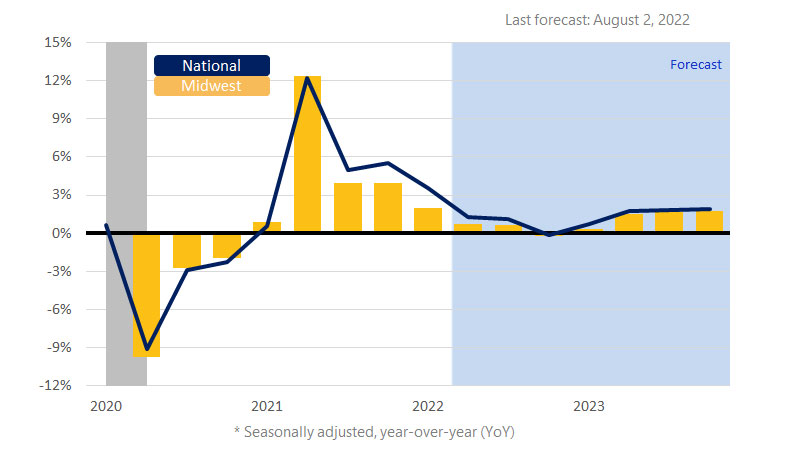
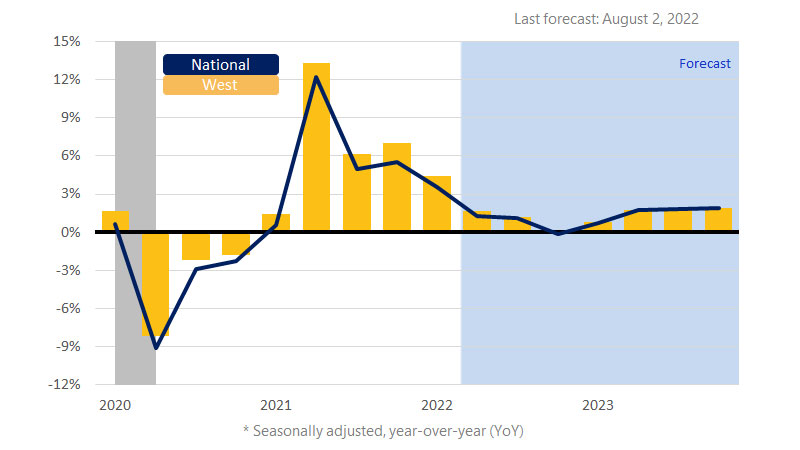
The confidence gap between current and future conditions is largest in the Midwest, providing evidence that the region will underperform all others in GDP and consumer spending. Due to labor supply issues, we expect the Midwest to trail the pack in job creation as well. Our expectation that the West would outpace all other regions in terms of Q1 GDP growth turned out to be correct, and that trend has likely continued in Q2 as states like Hawaii and Nevada tapped into the ongoing national travel rebound. Furthermore, the West’s return to pre-pandemic levels of employment in Q2 is a positive sign that the nationwide job market recovery is on pace to be completed in Q3. We anticipate the South’s GDP and consumer spending growth to remain resilient despite having the nation’s highest year-over-year (YoY) inflation rate. Employment growth in the Northeast likely remained strong through the first half of the year and we expect the region to maintain momentum during the second half.