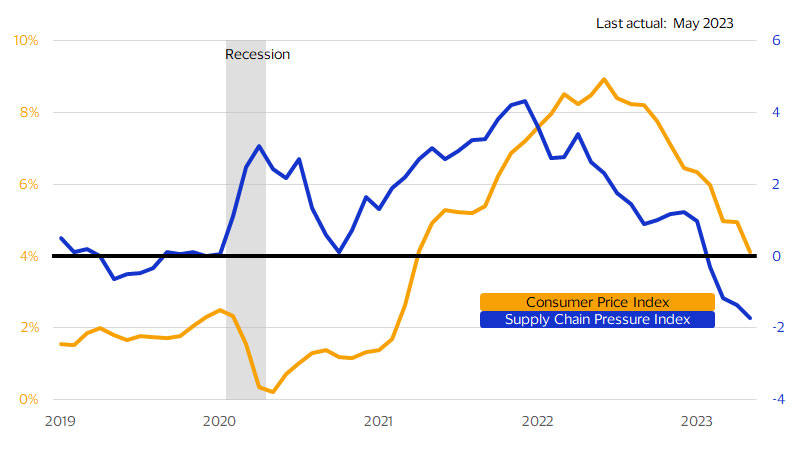
Lower inflation is taking pressure off consumer budgets

U.S. Consumer Monitor
June 2023 – After two years of high inflation, consumers are finally getting a breather. Prices for consumer goods and services are cooling off, and progress has been particularly robust over the last few months.¹ Inflation has improved quickly in categories that dominate the typical household budget, such as food, energy, and transportation. In part, this has resulted from a major restoration of global supply chains.² In most sectors, inventory-to-sales ratios have returned to pre-pandemic levels,³ and shipping costs are falling across air, land, and sea.⁴ Used cars have become cheaper over the past year,⁵ and gas prices have declined by 20 percent,⁶ taking pressure off households that drive to work and school. The Federal Reserve has raised interest rates aggressively, which has softened macroeconomic demand, and these hikes will continue to push inflation down over the next 12-24 months.

Consumer Price Index (CPI) and Global Supply Chain Pressure Index (GSCPI)
(CPI = Seasonally adjusted (SA), YoY percent; GSCPI = standard deviation from average)

Consumer Price Index (CPI) and Global Supply Chain Pressure Index (GSCPI). See image description for details.
Line chart showing the Consumer Price Index and the Global Supply Chain Pressure Index. The Consumer Price Index is shown as a year-over-year percent change. It begins in January 2019 at 1.5 percent, remains within a range of 1.5 percent to 2.5 percent through January 2020, falls to 0.2 percent by May 2020, rises to 8.4 percent by June 2022, and falls to 4.1 percent by May 2023. The Global Supply Chain Pressure Index is shown as standard deviations from its average value. It starts at 0.5 in January 2019, remains within a range of 0.5 to -0.7 through January 2020, rises to 3.1 by April 2020, falls to 0.1 by September 2020, rises to 4.3 by December 2021, and falls to -1.7 by May 2023.
Sources: Visa Business and Economic Insights, U.S. Department of Labor, and Federal Reserve Bank of New York

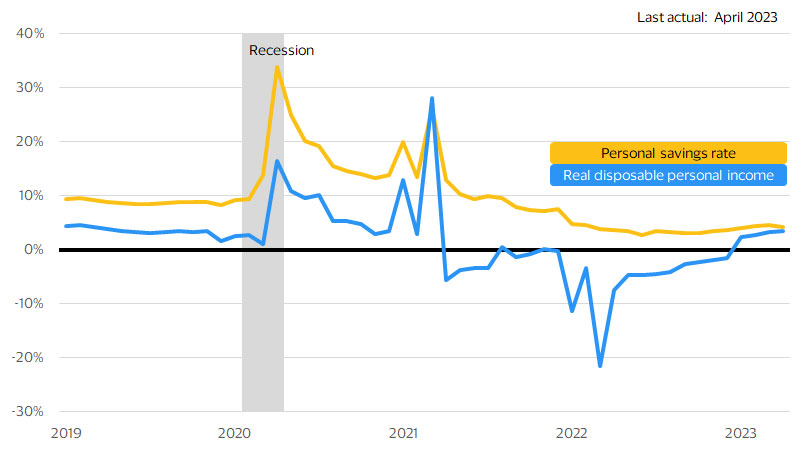
Incomes are finally outpacing inflation

For most of 2022, inflation outpaced incomes, putting consumers between a rock and a hard place and likely inducing major financial stress.⁷ After living through the pandemic and its various restrictions, most people chose to spend despite the high inflation, saving less of their income to recoup lost experiences.⁸ They tapped the excess savings they accumulated when the world was largely closed, spending on necessities and discretionary categories alike. Some also withdrew newfound wealth from their stock holdings and extracted equity from their homes. This phenomenon, know as the “wealth effect,” helped to support spending during an exceptionally challenging period. But the tables turned in 2023, when incomes began to outpace inflation again.⁹ By April, inflation-adjusted personal disposable income was rising at rates that were typical before the pandemic, returning a partial sense of normalcy to household budgets. How will this new breathing room impact spending in the near-term? It will almost certainly soften the economic damage from recent layoffs and rising interest rates.

Real disposable personal income (RDPI) and personal savings rate
(RDPI = YoY percent, savings rate = share of personal income)

RDPI and personal savings rate. See image description for details.
Line chart showing real disposable personal income and the personal savings rate. Real disposable personal income is shown as a year-over-year percent change. It starts in January 2019 at 4.4 percent, falls to 1.7 percent by December 2019, rises to 16.4 percent by April 2020, falls to 2.9 percent by November 2020, rises to 28.0 percent by March 2021, falls to -21.6 percent by March 2022, then rises to 3.4 percent by April 2023. The personal savings rate is shown as a share of total personal disposable income. Is starts in January 2019 at 9.3 percent, falls to 8.3 percent by December 2019, rises to 33.8 percent by April 2020, falls to 13.3 percent by November 2020, rises to 26.3 percent by March 2021, falls to 3.0 percent by September 2022, then rises to 4.1 percent by April 2023.
Sources: Visa Business and Economic Insights and U.S. Department of Commerce

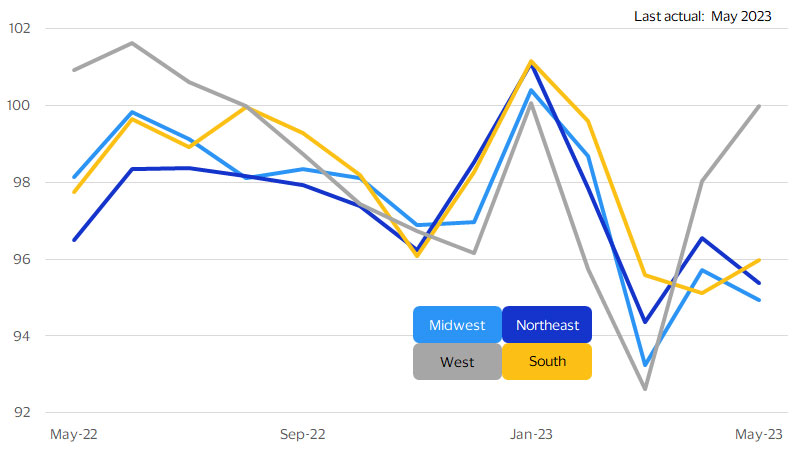
Inflation and spending differ by region

Inflation’s impact on consumer behavior is evident in the Spending Momentum Index (SMI), Visa’s proprietary indicator derived from millions of aggregated, depersonalized credit card and debit card transactions and third-party data. In recent months, inflation has improved most dramatically in the Midwest and the Northeast.¹⁰ In these regions, gas prices have declined at the sharpest rates, giving consumers a much-needed break.¹¹ The SMI also shows the lowest readings in these areas, suggesting that consumers are pocketing some of these savings, as evidenced by higher personal savings rates. The West, by contrast, has surged ahead with major upticks in the SMI. There, lower gas production has prevented prices from falling as far, putting comparatively more upward pressure on spending. At the same time, high snowpacks have extended the ski season in the Rockies and the Sierra Nevada, generating additional spending momentum.

Spending Momentum Index by region
(Seasonally adjusted; ≥100 = expansion, <100 = contraction)

Spending Momentum Index by region. See image description for details.
Line chart showing the Spending Momentum Index (SMI) for the Midwest, West, Northeast, and South. The SMI indicates a contraction in spending momentum when it is below 100 and an increase in spending momentum when it is above 100. The SMI for the Midwest, Northeast, and South largely move together. They start within a range of 96.5 to 98.1 in May 2022, fall to a range of 96.1 to 96.9 by November 2022, rise to a range of 100.4 to 101.2 by January 2023, and fall to a range of 94.9 to 96.0 by May 2023. The West starts at 100.9 in May 2022, falls to 96.2 by December 2022, rises to 100.1 by January 2022, falls to 92.6 by March 2023, and rises to 100.0 by May 2023.
Sources: Visa Business and Economic Insights and VisaNet

Footnotes

Forward-Looking Statements 

This report may contain forward-looking statements within the meaning of the U.S. Private Securities Litigation Reform Act of 1995. These statements are generally identified by words such as “outlook”, “forecast”, “projected”, “could”, “expects”, “will” and other similar expressions. Examples of such forward-looking statements include, but are not limited to, statement we make about Visa’s business, economic outlooks, population expansion and analyses. All statements other than statements of historical fact could be forward-looking statements, which speak only as of the date they are made, are not guarantees of future performance and are subject to certain risks, uncertainties and other factors, many of which are beyond our control and are difficult to predict. We describe risks and uncertainties that could cause actual results to differ materially from those expressed in, or implied by, any of these forward-looking statements in our filings with the SEC. Except as required by law, we do not intend to update or revise any forward-looking statements as a result of new information, future events or otherwise.


Disclaimer 

The  Visa U.S. SMI is based on a sample of aggregated, depersonalized VisaNet and third-party data; it is not reflective of Visa operational and/or financial performance. SMI is provided “as is” without warranties of any kind, express or implied, including, without limitation, as to the accuracy of the data or the implied warranties of merchantability, fitness for a particular purpose, and/or non-infringement. The views, opinions, and/or estimates, as the case may be (“views”), expressed herein are those of the Visa Business and Economic Insights team and do not necessarily reflect those of Visa executive management or other Visa employees and affiliates. This presentation and content, including estimated economic forecasts, statistics, and indexes are intended for informational purposes only and should not be relied upon for operational, marketing, legal, technical, tax, financial or other advice and do not in any way reflect actual or forecasted Visa operational or financial performance. Visa neither makes any warranty or representation as to the completeness or accuracy of the views contained herein, nor assumes any liability or responsibility that may result from reliance on such views. These views are often based on current market conditions and are subject to change without notice.


SMI Methodology

The Visa U.S. Spending Momentum Index (SMI) measures the breadth of year-over-year change in household spending within an economy, including the share of households with increased spending compared with those where spending was stable or declined. The index is generated using proprietary techniques that extract economic signals from business-related noise inherent in VisaNet transaction data, such as portfolio flips, routing changes, or evolving acceptance across geographies or merchant segments. Regional and national aggregates are population-weighted averages. The resulting sample data is then aggregated using a diffusion index framework in which index values are scored from 0 to 200. Values above 100 indicate broad-based net acceleration in economic momentum. Values below 100 indicate contraction on an annual basis. 


Visa’s team of economists provide business and economic insights with up-to-date analysis on the latest trends in consumer spending and payments. Sign up today to receive their regular updates automatically via email.