Weekends are the new weekdays for restaurants, as remote work alters traffic to urban centers

Remote work alters restaurant visits and spending in major global cities
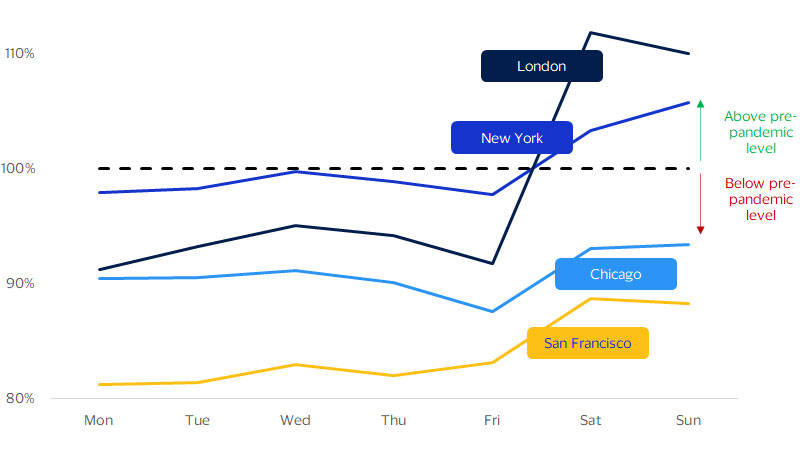
Leveraging card spending data from VisaNet across major global metropolitan centers, we can see that downtown-area restaurants were susceptible to the more widespread adoption of remote working arrangements. An analysis of in-person transactions at restaurants by day of the week (using this number as a proxy for traffic) shows that weekday traffic remains below pre-pandemic levels. Pre-pandemic, weekdays were generally the busiest for restaurants and cafes in major cities, as people went to work, grabbed coffee on the go, dined at restaurants during lunch breaks and went out for dinner or drinks after work. Interestingly, San Francisco’s recovery in weekday restaurant visits was the weakest among the cities we examined. This is consistent with the city’s high concentration of tech companies known for their more flexible working arrangements, which now incorporate more remote work in the post-pandemic era.³
Recovery in restaurant traffic for all cities appeared to be strongest on weekends. The degree of variability in restaurant traffic recovery and number of dine-in transactions by day of the week suggests that the shift in the work structure had a sizeable impact on these merchants.
Restaurants’ traffic recovery varies by day of the week
In-person visits to restaurants in 2022 compared to the same days in 2019
(Based on number of transactions, grouped by day of the week)
Weekends’ share of restaurant traffic rises
Distribution of in-person visits to restaurants by day of the week, percentage of total weekly visits (Based on number of transactions, grouped by day of the week)
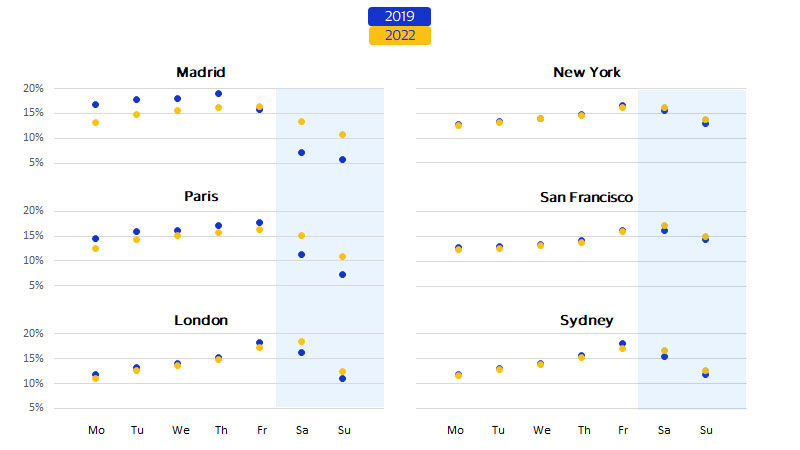
In Madrid, Paris and London, Mondays saw the sharpest drop in the share of total weekly in-person restaurant dine-ins based on the number of card-present transactions. The decline is likely due to the fact that Monday is one of the most popular days to work from home.
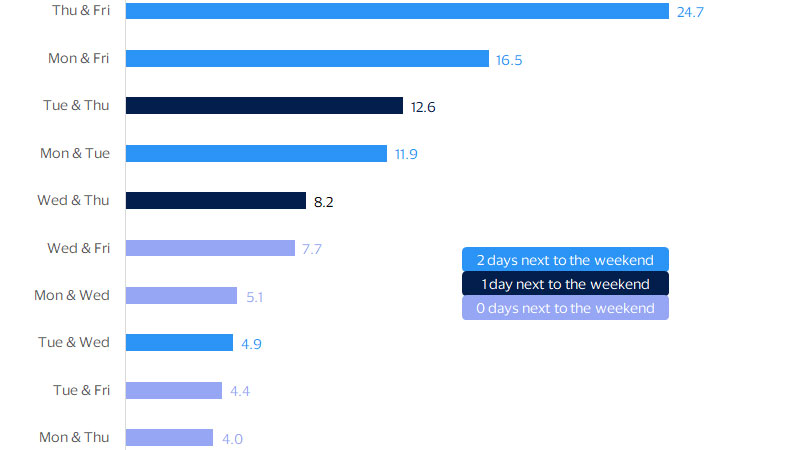
When asked in a survey on remote work which two-days they preferred to work from home, 24.7 percent of full-time workers across 27 countries said they prefer Thursday and Friday, followed by 16.5 percent saying they preferred Monday and Friday.⁴ The negative impact of WFH on restaurant traffic on Friday might be cushioned by the fact that it is the beginning of the weekend and people often go out at night.
Days close to the weekend are popular for WFH
Most popular two-day combinations for working from home, percent agree
The status of return to office worldwide
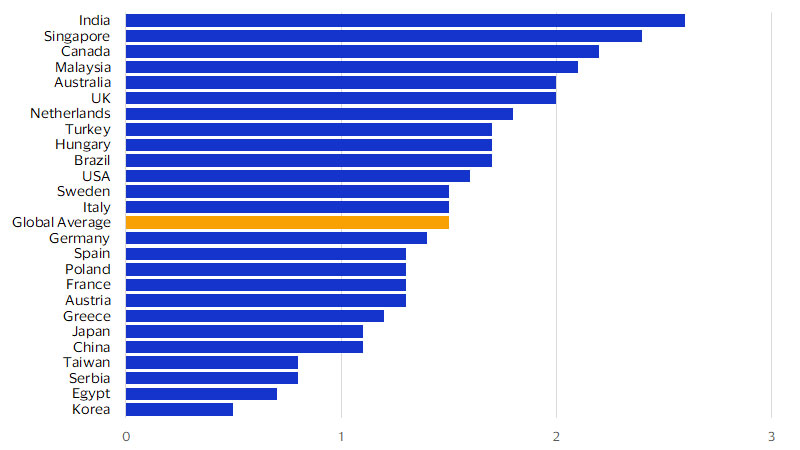
The RTO movement may have reached an equilibrium. Across the globe, the typical employee spends approximately 1.5 days working from home per week, which is much higher than before the pandemic but much lower than in 2020 or 2021. Most countries are close to the global average of 1.5 days per week, including large economies like Brazil, Germany and the United States.⁵ However, some jurisdictions have followed divergent WFH paths. At the extremes, more than half of all workdays are performed remotely in India, whereas just 10 percent are performed remotely in Korea.
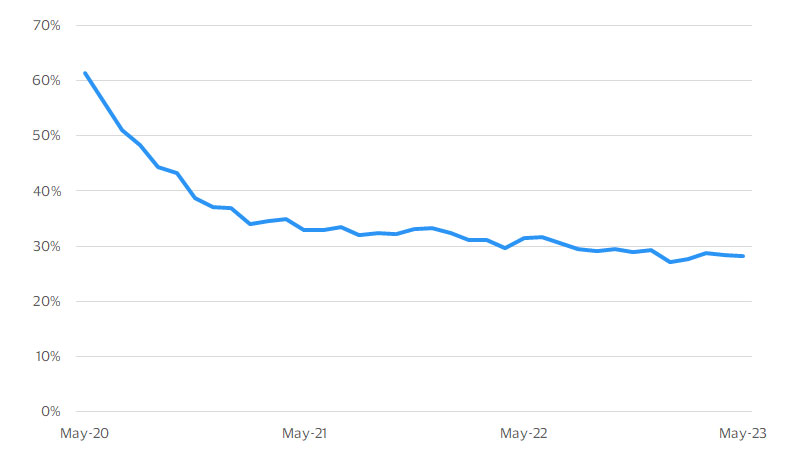
In the United States, which has the most detailed data on remote work, approximately 28 percent of working days were performed from home in early 2023.⁶ This is starkly different from 46 percent in 2020, showing a rapid return to the worksite as the economy reopened, but is largely unchanged from 30 percent in 2022, suggesting a new equilibrium.
Working from home varies by nation
Paid full days worked from home per week, country-level averages (Last actual: 2022)
Working from home in the United States
Percent of paid full days worked from home, NSA (Last actual: May 2023)
Some industries never truly went remote, including hospitality, transportation, retail and manufacturing.⁷ Working on-site is a fundamental requirement for many jobs in these sectors. Rather than transitioning between WFH and RTO, these industries had large-scale layoffs and re-hirings, a process that is now mostly complete.
Remote and at-home arrangements are most common in knowledge-based sectors like tech and finance, where almost half of all work is now performed off-site.⁸
Flexible work arrangements carry significant implications for consumer spending
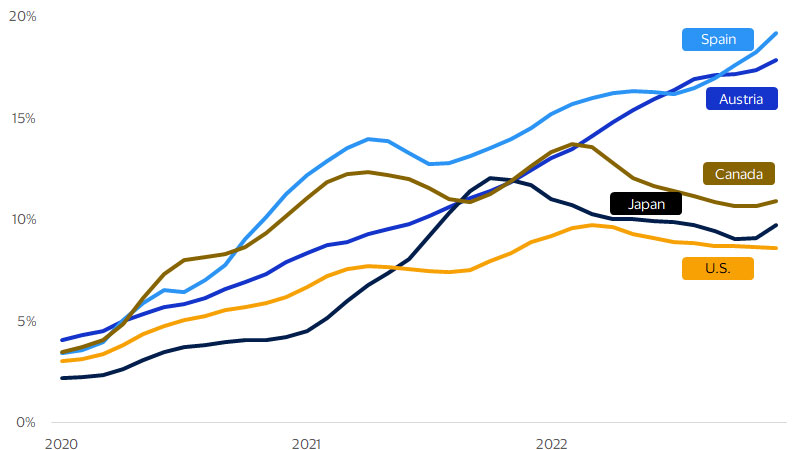
Share of job postings advertising WFH
Percent, 3 month moving average, NSA (Last actual: December 2022)
Understanding developments in remote work has become a critical component of business intelligence for restaurants and other merchants. Remote and hybrid employees earn far more than their on-site counterparts, and they tend to be younger.¹⁰ Hybrid workers in the U.S. typically earn more than $80,000 annually, while fully remote workers earn $74,000 and fully on-site employees make $55,000.¹¹ Hybrid and remote work is most common for early and mid-career professionals, representing more than 40 percent of the millennial and Gen Z workforce. By contrast, fully on-site is the norm for Gen X and baby boomers.
Remote and hybrid workers are also clustered in large cities. Despite the pandemic-induced migration wave, where people moved outward toward the suburbs and the countryside, remote work is still predominately a big-city phenomenon. For example, across the 10 largest cities in the U.S., almost 35 percent of paid working days are performed from home, a share that is growing. In smaller cities and towns, more than 75 percent of paid working days are performed on-site.¹²
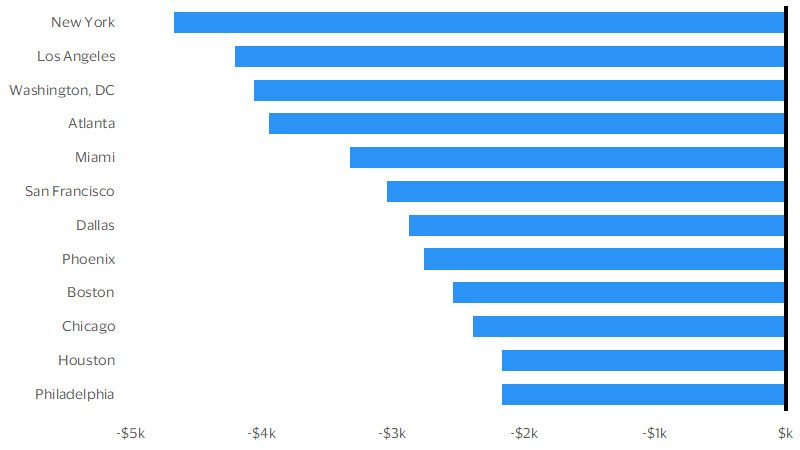
Aside from changing the frequency and timing of in-person visits, remote and hybrid work has major implications for the amount that consumers spend during the workday. Across large U.S. cities, surveys indicate major workday spending reductions on meals, entertainment and shopping near the worksite. ¹³ In New York, where food and entertainment prices are high, people reported spending almost $4,700 less in 2022 than in 2019. Los Angeles, Washington D.C., Atlanta, and Miami show similarly large impacts. Even in Philadelphia and Houston, where consumer prices are lower and WFH is less common, workday-related spending has fallen by almost $2,200 per employee.
Workday spending has declined in U.S. cities
Change from 2019, thousands of dollars per worker per year (Last actual: November 2022)
Footnotes
- ¹ Visa Business and Economic Insights and Google
- ² Barrero, Bloom, Davis, Dolls, Giray Aksoy, and Zarate, “Working from home around the world,” October 2022. Online at: https://cepr.org/voxeu/columns/working-home-around-world
- ³ Visa Business and Economic Insights and WFH Research
- ⁴ WFH Research, “SWAA December 2022 Updates,” Survey of Working Arrangements and Attitudes, www.wfhresearch.com
- ⁵ Barrero, Bloom, Davis, Dolls, Giray Aksoy, and Zarate, “Working from home around the world,” October 2022. Online at: https://cepr.org/voxeu/columns/working-home-around-world
- ⁶ Visa Business and Economic Insights and WFH Research
- ⁷ Visa Business and Economic Insights and WFH Research
- ⁸ Visa Business and Economic Insights and WFH Research
- ⁹ Adrjan, Ciminelli, Judes, Koelle, Schwellnus, and Sinclair, “Working from home after COVID-19: Evidence from job postings in 20 countries,” SSRN, December 2022. Online at: https://papers.ssrn.com/sol3/papers.cfm?abstract_id=4064191
- ¹⁰ Visa Business and Economic Insights and WFH Research
- ¹¹ Visa Business and Economic Insights and WFH Research
- ¹² Visa Business and Economic Insights and WFH Research
- ¹³ Visa Business and Economic Insights and WFH Research
Forward-Looking Statements
This report may contain forward-looking statements within the meaning of the U.S. Private Securities Litigation Reform Act of 1995. These statements are generally identified by words such as “outlook”, “forecast”, “projected”, “could”, “expects”, “will” and other similar expressions. Examples of such forward-looking statements include, but are not limited to, statements we make about Visa’s business, economic outlooks, population expansion and analyses. All statements other than statements of historical fact could be forward-looking statements, which speak only as of the date they are made, are not guarantees of future performance and are subject to certain risks, uncertainties and other factors, many of which are beyond our control and are difficult to predict. We describe risks and uncertainties that could cause actual results to differ materially from those expressed in, or implied by, any of these forward-looking statements in our filings with the SEC. Except as required by law, we do not intend to update or revise any forward-looking statements as a result of new information, future events or otherwise.
Disclaimer
The views, opinions, and/or estimates, as the case may be (“views”), expressed herein are those of the Visa Business and Economic Insights team and do not necessarily reflect those of Visa executive management or other Visa employees and affiliates. This presentation and content, including estimated economic forecasts, statistics, and indexes are intended for informational purposes only and should not be relied upon for operational, marketing, legal, technical, tax, financial or other advice and do not in any way reflect actual or forecasted Visa operational or financial performance. Visa neither makes any warranty or representation as to the completeness or accuracy of the views contained herein, nor assumes any liability or responsibility that may result from reliance on such views. These views are often based on current market conditions and are subject to change without notice.
Visa’s team of economists provide business and economic insights with up-to-date analysis on the latest trends in consumer spending and payments. Sign up today to receive their regular updates automatically via email.