Searching for the consumer of tomorrow: The Gen Z opportunity

Sizing the Gen Z opportunity
As we move past the economic headwinds of 2023—high interest rates, high inflation, and slowing job creation—new challenges will unfold over the next decade. Demographic shifts are expected to put downward pressure on economic growth, creating potential headwinds for consumer spending.¹
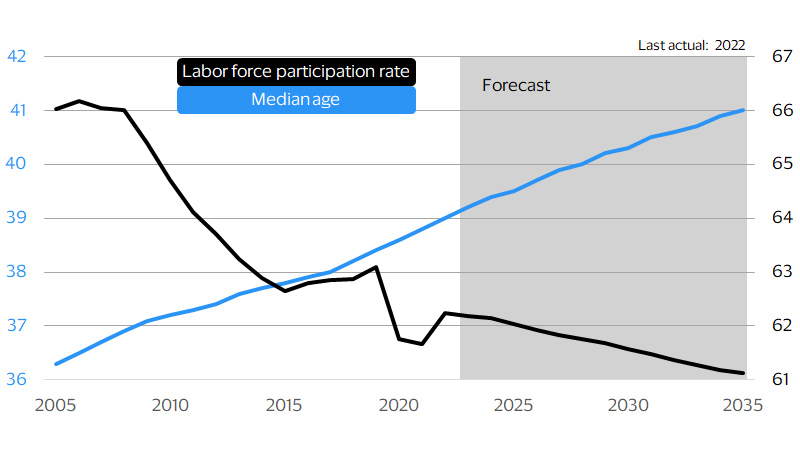
The U.S. population is aging rapidly, with an average of 12,000 people turning 65 every day.² Most of the population will soon be above age 40 and a growing share will likely enter retirement.³ Why does this matter? It is expected to result in lower labor force participation rates, fewer workers per capita, slower gross domestic product (GDP) growth and slower spending growth.
Older age groups have lower rates of labor force participation
(Median age of U.S. population and labor force participation rate, median age = years, LFPR = percent)
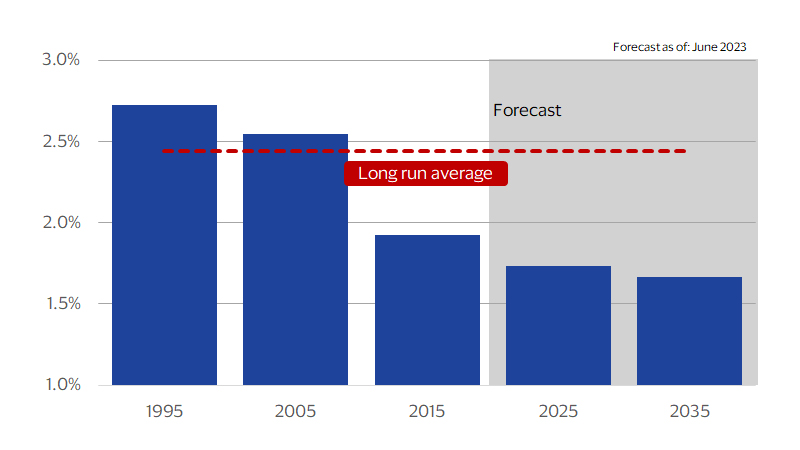
Weaker economic growth means slower spending growth
(Annual growth in real potential GDP, YoY percent change)
Highlights:
- Gen Z’s influence on the consumer base is expected to grow by 2035
- Gen Z spending preferences will evolve as they move to the next stage of their life
- Gen Z is using payment methods in new ways
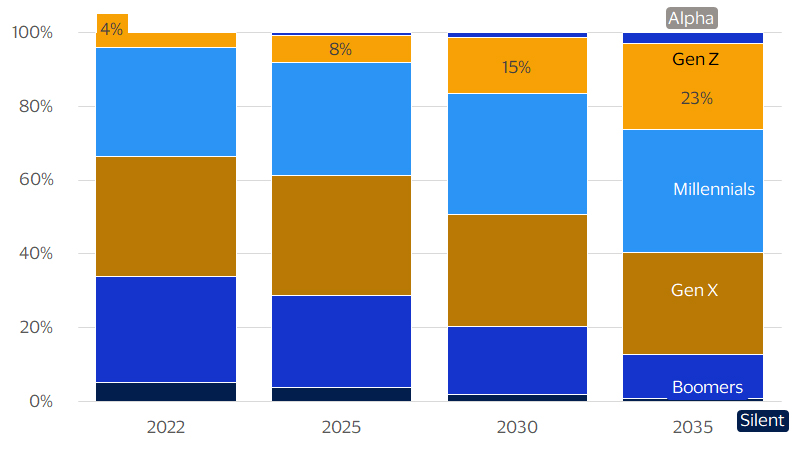
Enter Gen Z. Consumers in this generation were responsible for just 4 percent of spending in 2022.⁴ They currently straddle the line between adolescence and early adulthood, and many do not earn an income. They range from age 10 to age 26, with some entering the workforce for the first time.⁵ By contrast, baby boomers and Gen Xers accounted for more than 60 percent of spending in 2022.⁶ Many were also in their peak earning years, giving them critical importance to consumer-facing companies.
If we fast forward to the middle of the next decade, the landscape is likely to look remarkably different. Gen X and baby boomers are likely to represent just 40 percent of spending as some approach retirement and others rely on fixed incomes.⁷ Millennials are expected to largely maintain their share of spending between 2022 and 2035. Virtually all millennials are already in the peak working period, which occurs between ages 25 and 54, so their labor force participation rates won’t change substantially.⁸ Their incomes will increase as they progress in their careers, but this is expected to have a marginal impact on their ability to spend.
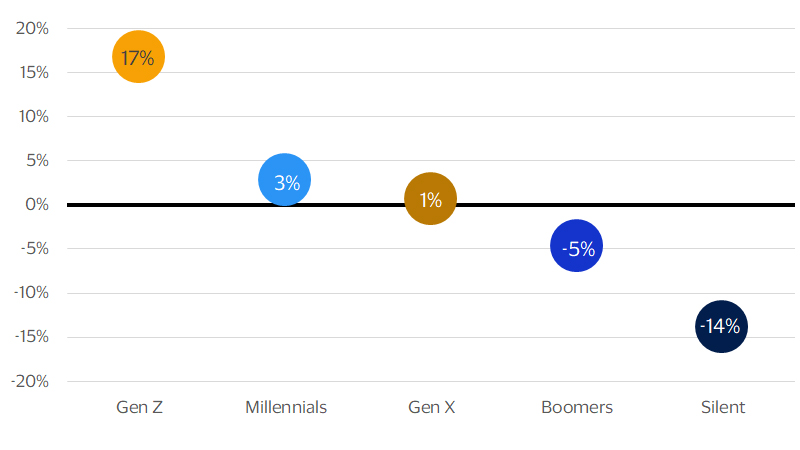
By contrast, Gen Z’s spending is expected to ramp up dramatically, and by 2035 they are predicted to account for 23 percent of the spending base economywide.⁹ Their inflation-adjusted consumer outlays will increase by an average of 17 percent per year, more than five times as fast as any other group. Said differently, Gen Z will account for virtually all spending growth through 2035. By the middle of the next decade, this group could represent a $4.2 trillion opportunity.
Virtually all spending growth through 2035 will come from the Gen Z consumer
Annual average growth in real personal consumption expenditures by generation 2022-2035, percent
Share of consumer spending by generation (Percent)
Getting to know Gen Z
Gen Z is fast becoming a critical consumer segment – they are clearly the consumer of tomorrow – creating urgency in capturing their business. Current research paints an emerging picture of their preferences and priorities, highlighting distinct differences between them and their older counterparts. By 2035, the youngest Gen Z individuals will be over age 22, and most will likely have entered the workforce. They are expected to be highly educated,10 implying low unemployment rates and high earnings. They are a complex group, punctuated by a long list of contradictions. They appreciate success but want balance.¹¹ They value individual expression, but they crave community after experiencing the challenges of being apart. They are also the most multicultural generation, coming from diverse backgrounds and life experiences.¹²
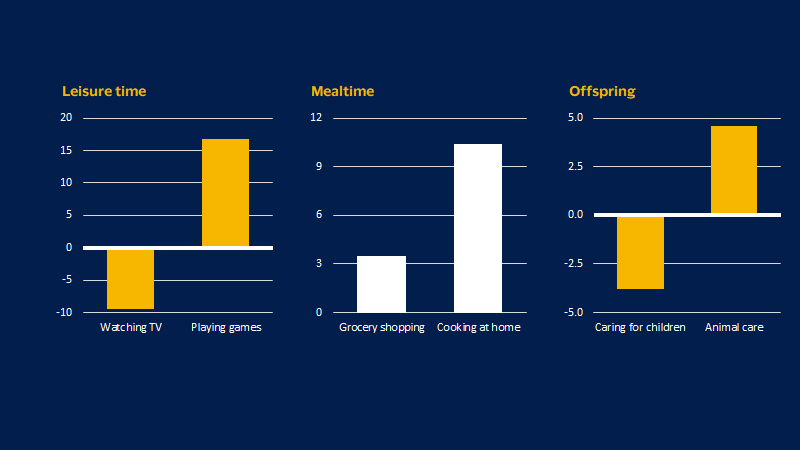
Hard data shows the unique preferences of Gen Z. We find strong evidence that Gen Z spends their time, and likely their dollars, in ways that differ from generations past, and we focus on three major facets of daily life: leisure time, mealtime and family time.
Leisure time
Compared to millennials at the same age, Gen Z spends far more time playing games and far less time watching TV.¹³ They are the gamer generation, with 35 percent playing games on a typical day. They value gaming for social connection and self-expression,¹⁴ and they spend real dollars on in-game purchases. According to VBEI research, gaming is correlated with a high-consumption lifestyle, with average monthly credit card expenditures 13 percent higher for gamers than non-gamers.¹⁵
Mealtime
Gen Z has a proclivity for cooking at home. Almost 39 percent of this generation cooks at home on an average day, compared to just 28 percent of millennials at the same age. In part, this appears to be a result of the pragmatic nature of the Gen Z shopper, but it’s also a result of their interconnected, online lifestyles. Popular social media apps get billions of views on food-related content, incentivizing Gen Z to share their creations with the world – a phenomenon that has contributed to major differences in behavior.¹⁶
Family time
Gen Z is starting families at later ages, with the birthrate consistently in decline for women in their 20s.¹⁷ At the same time, they are growing their families in different ways, spending more time caring for pets than millennials at the same age.¹⁸ American consumers spend more than $180 billion on their pets each year, and Gen Z is poised to spend more than its fair share.¹⁹
What is unique about the Gen Z experience?
Gen Z time usage compared to millennials at the same age
(Change in share of individuals participating, 2012-2022, percentage points)
Gen Z’s spending priorities, today and tomorrow
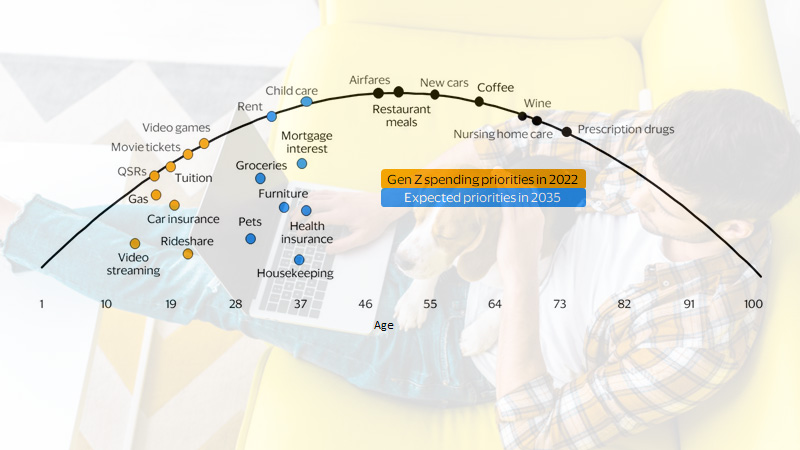
While Gen Z is unique in many of its preferences, its spending patterns over time may be less distinctive since these tend to change in predictable ways as people age. For example, in 2021, spending on prescription drugs was highest among consumers at age 75.²⁰ Spending on coffee peaked at age 60, and spending on airfares peaked at age 43. In each year during the preceding decade, spending on these (and other) categories peaked at approximately the same ages, giving us a reliable tool for assessing Gen Z’s expected consumption patterns going forward.
In 2022, when Gen Z ranged from grade school to entry-level employee, they claimed peak spending for quick-service restaurants, movie tickets, video games and school tuition.²¹ In many ways these results are intuitive – they prioritized affordable entertainment options and they accounted for the largest share of college students. Their share-of-wallet also tilted towards gas, car insurance and rideshare services as they began venturing into the world for the first time.
By 2035, when Gen Z will range from age 22 to 38, they will be in a decidedly different stage of life. Most are likely to be in the workforce, earning full-time salaries and fully supporting themselves. As such, their spending priorities are likely to shift from tuition to rent and mortgage interest. Movie ticket purchases should give way to childcare costs and quick-service restaurant meals are expected to be superseded by groceries. And, they will foot their own pet care bills rather than relying on their parents or guardians. We’ve identified Gen Z as the consumer of tomorrow, and we’re confident they will account for most spending growth through 2035. Their consumption habits are expected to change as they age, and these changes will represent a major opportunity to acquire Gen Z as a customer.
What are Gen Z’s spending priorities?
(Spending priorities by age)
Doing business with Gen Z
This all begs the question: What are the best channels for reaching these consumers of tomorrow? It may seem obvious, but video games and social media apps hold massive potential. Compared to other generations, Gen Z regularly uses most social media apps at higher rates.²² Crucially, they also make in-app purchases at high rates. For some of the most commonly used apps, 27 percent to 36 percent of Gen Z consumers make regular in-app purchases. As the online generation, finding them online may be imperative to capturing their business.
As the gamer generation, Gen Z is also contributing to the growing trend of in-game commerce. More than a third of the Gen Z population plays games on a typical day, and the average user spends more than 90 minutes on platforms like Roblox and Fortnite.²³ This creates real opportunities for doing business with Gen Z as in-game economies transform into virtual marketplaces that accept dollars, euros, yen and other currencies.
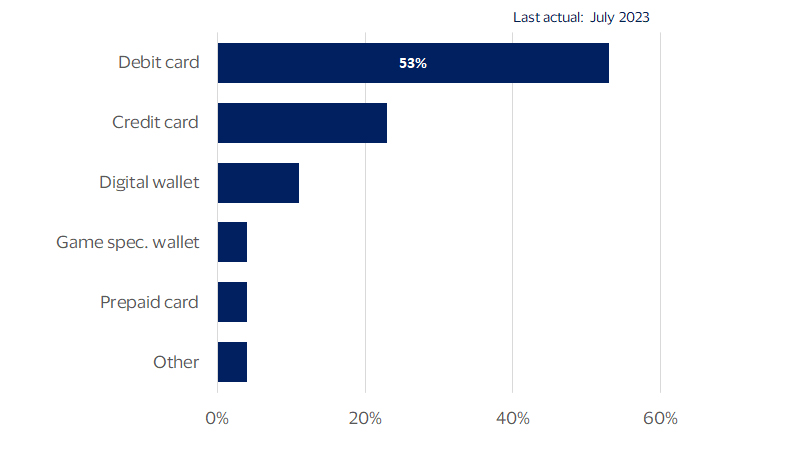
If Gen Z is spending time – and making purchases – in online environments, what are their preferred payment methods? As young consumers, they heavily rely on debit cards and are using these cards in distinct ways. In gaming environments, they use debit cards at much higher rates than other forms of payment.²⁴ In mid-2023, more than half used a debit card for their most recent in-game purchase, while only 23 percent used a credit card, 11 percent used a digital wallet and 4 percent used a prepaid card.
Across all types of transactions, Gen Z also shows a strong preference for friction-free shopping, including voice-activated options.²⁵ They have a reputation for avoiding person-to-person phone calls, but they’re comfortable speaking into their smartphone apps. A plethora of apps now respond to phrases like “please order me a pizza,” and Gen Z is using these voice-activated transactions more frequently each year. What is their most common payment form in voice-activated apps? Debit cards, by a considerable margin. Over the coming years, virtual marketplaces and innovative technologies are likely to support debit spending for companies that serve Gen Z.
Gen Z is likely to account for the majority of spending growth through 2035. Consumer-facing companies may need to adapt to a slower-growth environment, making it critical to identify new opportunities. According to research from VBEI, that opportunity lies in Gen Z.
Gen Z is a gaming generation that leverages debit
(Payment method used for last purchase by voice)
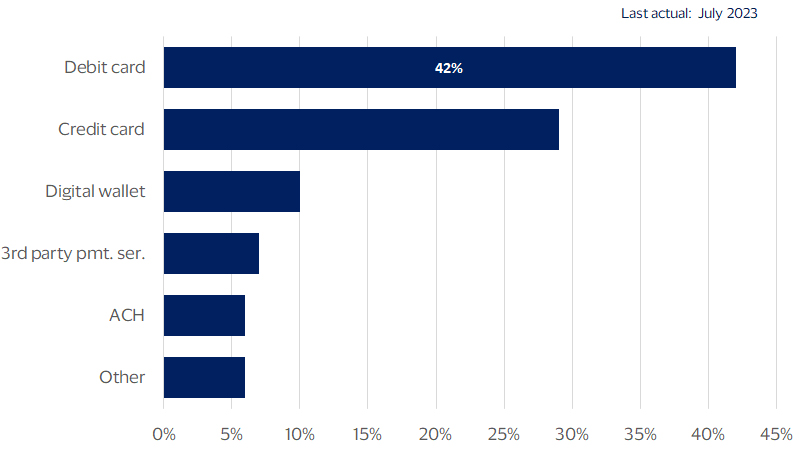
Gen Z desires friction-free shopping
(Payment method used for last in-game purchase)
Footnotes
- Visa Business and Economic Insights and Congressional Budget Office
- Visa Business and Economic Insights and U.S. Department of Commerce
- Visa Business and Economic Insights and Congressional Budget Office
- Visa Business and Economic Insights, Pew Research Center, and U.S. Department of Commerce
- Visa Business and Economic Insights, Pew Research Center, U.S. Department of Commerce, and U.S. Department of Labor
- Visa Business and Economic Insights, Pew Research Center, and U.S. Department of Commerce
- Visa Business and Economic Insights, Pew Research Center, Congressional Budget Office, U.S. Department of Commerce, and U.S. Department of Labor
- Visa Business and Economic Insights, Pew Research Center, Congressional Budget Office, U.S. Department of Commerce, and U.S. Department of Labor
- Visa Business and Economic Insights, Pew Research Center, Congressional Budget Office, U.S. Department of Commerce, and U.S. Department of Labor
- Visa Business and Economic Insights, Pew Research Center, and U.S. Department of Education
- Visa Business and Economic Insights and McKinsey and Co.
- Visa Business and Economic Insights and U.S. Department of Commerce
- Visa Business and Economic Insights and U.S. Department of Labor
- Visa Business and Economic Insights and Deloitte
- Visa Business and Economic Insights and VisaNet
- Visa Business and Economic Insights and CNBC
- Visa Business and Economic Insights and U.S. Department of Health and Human Services
- Visa Business and Economic Insights and U.S. Department of Labor
- Visa Business and Economic Insights and U.S. Department of Commerce
- Visa Business and Economic Insights and U.S. Department of Labor
- Visa Business and Economic Insights and U.S. Department of Labor
- Visa Business and Economic Insights and VBEI Quarterly U.S. Consumer Survey
- Visa Business and Economic Insights, U.S. Department of Labor, and Qustodio
- Visa Business and Economic Insights and VBEI Quarterly U.S. Consumer Survey
- Visa Business and Economic Insights and VBEI Quarterly U.S. Consumer Survey
Forward-Looking Statements
This report may contain forward-looking statements within the meaning of the U.S. Private Securities Litigation Reform Act of 1995. These statements are generally identified by words such as “outlook”, “forecast”, “projected”, “could”, “expects”, “will” and other similar expressions. Examples of such forward-looking statements include, but are not limited to, statements we make about Visa’s business, economic outlooks, population expansion and analyses. All statements other than statements of historical fact could be forward-looking statements, which speak only as of the date they are made, are not guarantees of future performance and are subject to certain risks, uncertainties and other factors, many of which are beyond our control and are difficult to predict. We describe risks and uncertainties that could cause actual results to differ materially from those expressed in, or implied by, any of these forward-looking statements in our filings with the SEC. Except as required by law, we do not intend to update or revise any forward-looking statements as a result of new information, future events or otherwise.
Disclaimer
The views, opinions, and/or estimates, as the case may be (“views”), expressed herein are those of the Visa Business and Economic Insights team and do not necessarily reflect those of Visa executive management or other Visa employees and affiliates. This presentation and content, including estimated economic forecasts, statistics, and indexes are intended for informational purposes only and should not be relied upon for operational, marketing, legal, technical, tax, financial or other advice and do not in any way reflect actual or forecasted Visa operational or financial performance. Visa neither makes any warranty or representation as to the completeness or accuracy of the views contained herein, nor assumes any liability or responsibility that may result from reliance on such views. These views are often based on current market conditions and are subject to change without notice.
Visa’s team of economists provide business and economic insights with up-to-date analysis on the latest trends in consumer spending and payments. Sign up today to receive their regular updates automatically via email.