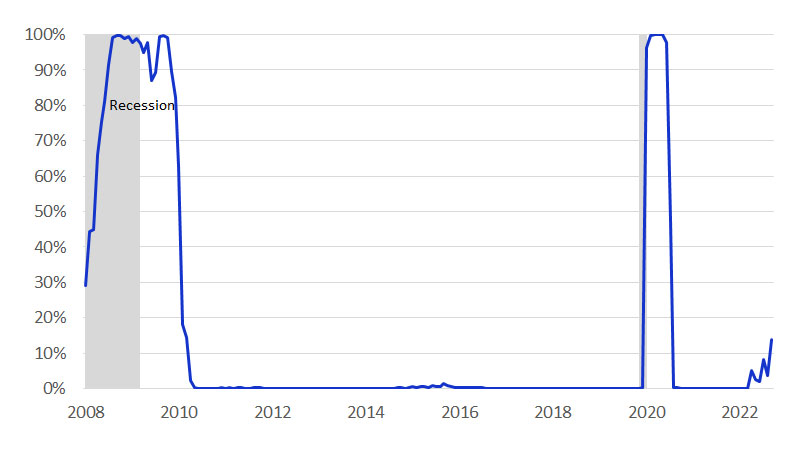
January 2023 – The intense atmospheric storms that swept in at the end of 2022 may be in the rearview mirror, but a new storm is brewing in the economy. Gross domestic product (GDP) growth in the fourth quarter of 2022 remained strong, but clear signs of a possible slowdown in 2023 are starting to appear. Recent softness in the housing market has translated into a slowdown in the construction sector. Our forecasts indicate that this housing market weakness will continue into 2023. Additionally, the last few months of 2022 pointed to a decline in future output and investment in the manufacturing and tech sectors. Finally, Visa’s newly developed Spending Momentum Index (SMI) Recession Nowcast* showed a rising share of the population living in an area that is likely already in recession (Figure below).
The construction, tech and manufacturing slowdown will likely have the biggest impact on the West and Midwest. Los Angeles, Phoenix and Minneapolis are the largest metro areas likely already in recession. Many states in the West benefitted from the COVID construction boom, but high home prices and the current mortgage rate environment have eroded affordability for consumers and caused a steep decline in demand. High borrowing costs are also hurting tech hubs in California and Washington, leading to a surge in layoff announcements in November, December and January. For much of 2022, the manufacturing sector struggled to keep up with demand due to supply chain issues, but the industry now faces the opposite problem—declining demand and large amounts of unsold inventory. We expect these pressures to have a disproportionate impact on gross domestic product (GDP) and employment in both the West and Midwest. The Northeast’s high concentration of employment and output in education and health services and the South’s high concentration of employment in government should shield these regions from the worst effects of the coming slowdown, as these sectors will likely be less harmed.