December 2022 – Anticipating the global economic outlook for 2023 is like waiting for the next season in a popular mini-series to drop. We all want to know if 2023 will resolve two very pressing questions that have emerged since 2021: will inflation finally be brought under control and will the short-term cost of this effort be worth the pain?
We leave off at the end of 2022 with central banks attempting to curb a worldwide surge in prices. None of the 46 central banks that use inflation targets to set their interest rates will likely meet their targets by year end.¹ With inflation averaging over 14 percent across their respective economies, we are left to truly wonder what it will take to bring inflation back in line with their average target of 3.5 percent. Why this matters is these central banks control variables that influence nearly 80 percent of total global consumer spending.² If they set rates too low, then inflation runs too hot, reducing the purchasing power of households. If rates are too high, then demand from consumers and businesses falls, leading to higher unemployment rates.
Like any good story, it comes with key subplots that weave together the interplay between inflation, interest rates and the business cycle, with each of our economists providing insights on the key factors in their region influencing our outlook, as well as the global implications:
- Our first subplot involves Europe, where the cost-of-living crisis is coming harder and later than many other regions. The fall in growth due to inflation and higher interest rates should be offset in 2023 by a cushion from high savings and a still healthy labor market, but how this plays out remains to be seen.
- Next, in countries where central banks have moved earlier, such as Canada, attention is shifting from inflation to how consumers react to higher debt costs and the value of assets more sensitive to higher rates, such as housing. As housing starts to turn will we see a repeat of the U.S. subprime crisis or something milder? Given that the most recent upturn in housing was related more to the shift to more remote working, perhaps the ride down will be milder than wilder.
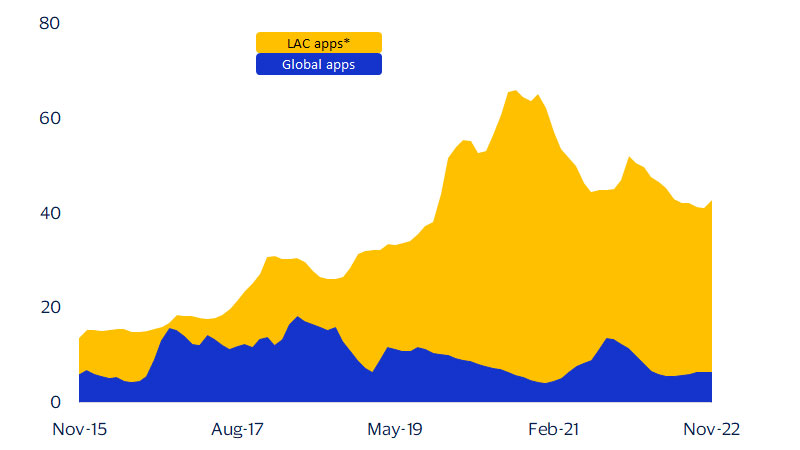
- As interest rates take an about-face, other areas of the market are also in flux. Valuations of technology firms in particular have taken a beating, and companies in the sector are scrambling to shore up cash flow. As they do, new questions arise about the future of technology and digital commerce. If what we see in Latin America is any indication, it’s too early to count these innovative companies out.
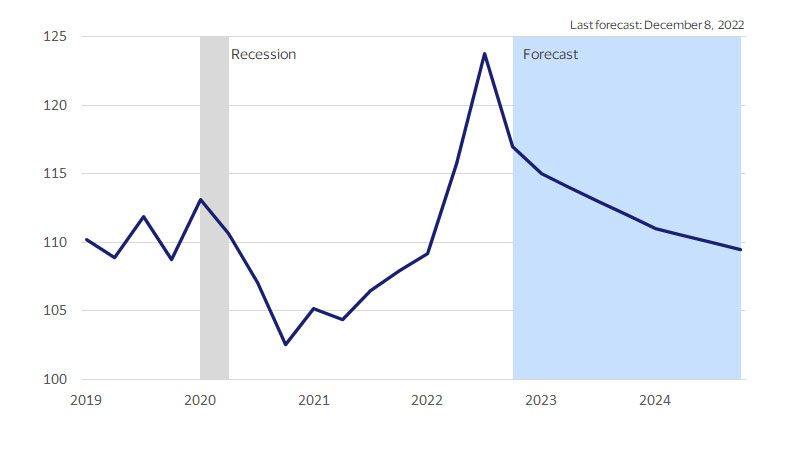
- Beyond the fact that the world has never seen as many central banks raise their rates at the same time (92 out of 103 tracked), two aspects of this cycle have unnerved markets: how far will central banks go and when will they stop? The uncertainty, in particular, around the U.S. Federal Reserve’s policies has helped in part to propel the U.S. dollar to multi-decade highs. In 2023, if the peak of the cycle nears, the dollar could reverse with important implications for businesses and economies around the world.
- Every good story brings in a hero—the knight in shining armor. With elevated inflation and interest rates leading to weaker consumer spending, especially in the more advanced economies, could China and Asia Pacific once again come in to move us back towards recovery and growth? So far, with China’s growing economic slowdown, this appears unlikely.
- Lastly, if not Asia, where will growth potentially accelerate as the down cycle comes to an end? One possibility is Central Europe, Middle East and Africa (CEMEA). After the global population passed 8 billion in late 2022 and with dramatic demographic shifts occurring worldwide, CEMEA could account for the next billion if current trends continue.
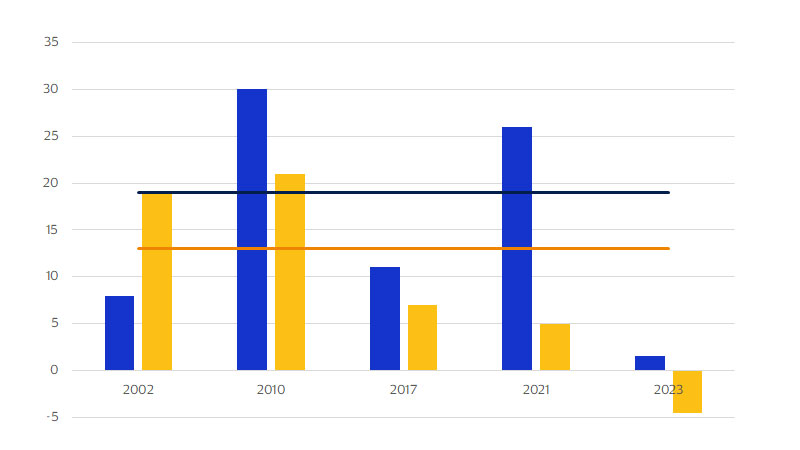
While the next year’s story has yet to be written, inflation most likely will be brought closer to target with the annual growth in global consumer prices expected to slow from 7.9 percent in 2022 to 5.4 percent in 2023.³ At the same time, real GDP growth is expected to halve from an estimated 3.0 percent this year to 1.5 percent next year⁴ (a level consistent with the global recession of 1991). If the downturn occurs, it should be shallower than the two most recent global recessions, although also potentially longer. 2022 ends on a cliff-hanger, leaving the world to wonder just how far the downturn will extend into 2023 or beyond. Stay tuned.