Will it be another holly jolly season for holiday shopping?

November 2023 – We start the holiday shopping season amid a backdrop of continued robust consumer spending. The last couple of holiday shopping seasons have been impacted by residual stimulus effects (2021) followed by high rates of inflation at this time last year. We think this year there will be fewer distortions to sales, implying that consumer fundamentals are likely to drive the pace of sales growth. Among the headwinds facing consumers this season are much higher interest rates and an increased difficulty in obtaining credit.¹ Additionally, we have seen hours worked trimmed back across some industries.² The news is not all bad though: job and wage gains have been robust through most of this year and moderating inflation pressure has supported spending growth.
When assessing future holiday sales, we pay particular attention to real disposable income growth. This real income growth measure has been relatively stable since the beginning of the year and tracking closely with retail sales on holiday related items in recent months (Fig. 1). Real incomes are up 3.5 percent as of September and are expected to remain relatively stable through December.³
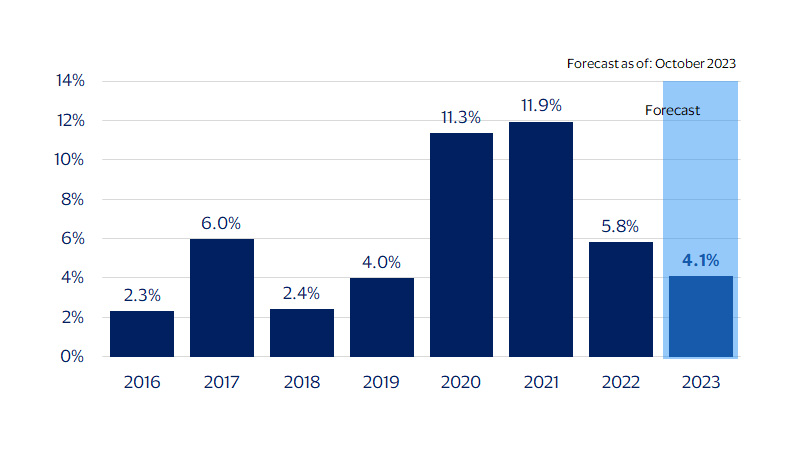
With holiday spending returning to its core drivers of consumer credit and real income growth, we see holiday sales rising 4.1 percent YoY this season. While this is likely to be the slowest year for holiday sales since 2019, it would still be higher than the average growth in sales during the last expansion (2010-2019) of 3.7 percent.
Sales growth of holiday categories* vs. real disposable income growth
(SA, YoY percent change)
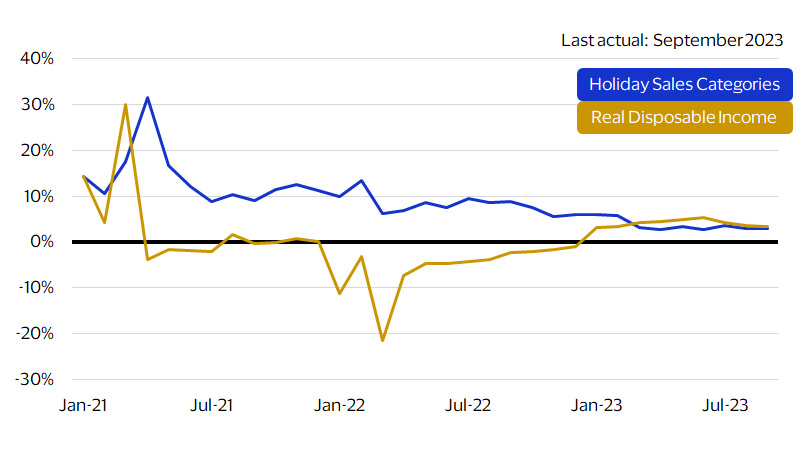
*We define holiday sales as seasonally adjusted nominal retail sales on all forms of payment less sales at automotive dealers, gas stations and restaurants for the months of November and December as reported by the U.S. Department of Commerce.
Highlights:
- Holiday sales are likely to be above average again this year
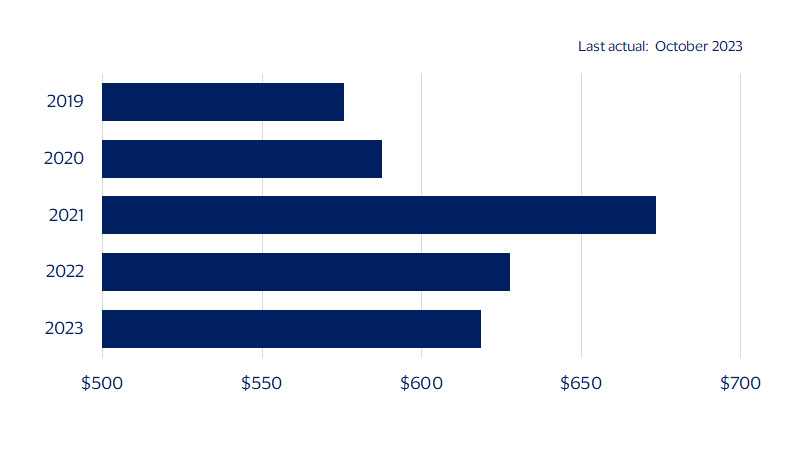
- Average holiday gift spend may decline
- Who will drive holiday spending this year?
Will consumers spend more or less this holiday season?
Holiday retail spending (retail sales excluding autos, gas and restaurants)
(YoY percent change)
Average amount consumers plan to spend on gifts this holiday season
(Dollars)
Footnotes
- Visa Business and Economic Insights and Federal Reserve Board
- Visa Business and Economic Insights and U.S. Department of Labor
- Visa Business and Economic Insights and U.S. Department of Commerce
- Visa Business and Economic Insights and Economic Insights Quarterly Consumer Survey, October 2023
- Average gift spending by income group from the October Economic Insights Quarterly Consumer Survey was weighted by the share of the consumer base by income level from the U.S. Department of Labor’s 2022 Consumer Expenditure Survey to get the average gift spending for all income groups.
Forward-Looking Statements
This report may contain forward-looking statements within the meaning of the U.S. Private Securities Litigation Reform Art of 1995. These statements are generally identified by words such as “outlook”, “forecast”, “projected”, “could”, “expects”, “will” and other similar expressions. Examples of such forward-looking statements include, but are not limited to, statement we make about Visa’s business, economic outlooks, population expansion and analyses. All statements other than statements of historical fact could be forward-looking statements, which speak only as of the date they are made, are not guarantees of future performance and are subject to certain risks, uncertainties and other factors, many of which are beyond our control and are difficult to predict. We describe risks and uncertainties that could cause actual results to differ materially from those expressed in, or implied by, any of these forward-looking statements in our filings with the SEC. Expect as required by law, we do not intend to update or revise any forward-looking statements as a result of new information, future events or otherwise
Disclaimer
The views, opinions, and/or estimates, as the case may be (“views”), expressed herein are those of the Visa Business and Economic Insights team and do not necessarily reflect those of Visa executive management or other Visa employees and affiliates. This presentation and content, including estimated economic forecasts, statistics, and indexes are intended for informational purposes only and should not be relied upon for operational, marketing, legal, technical, tax, financial or other advice and do not in any way reflect actual or forecasted Visa operational or financial performance. Visa neither makes any warranty or representation as to the completeness or accuracy of the views contained herein, nor assumes any liability or responsibility that may result from reliance on such views. These views are often based on current market conditions and are subject to change without notice.
Visa’s team of economists provide business and economic insights with up-to-date analysis on the latest trends in consumer spending and payments. Sign up today to receive their regular updates automatically via email.