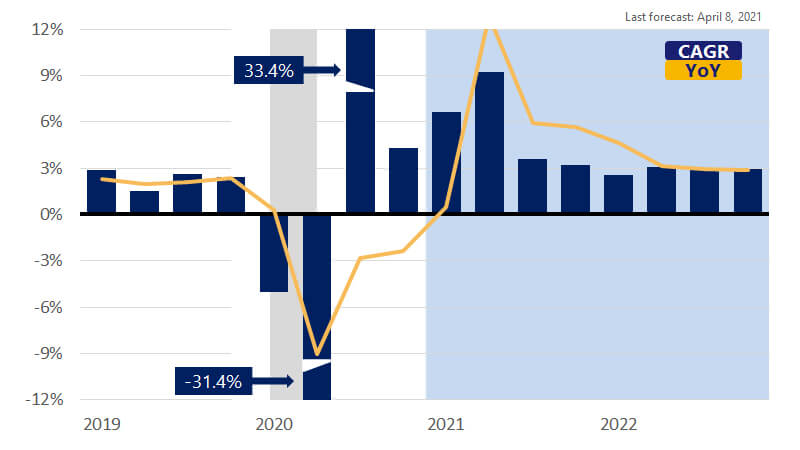
April 16, 2021 – Over the last month, the contours of growth for 2021 came into sharper focus. Nonfarm employment rose by 916,000 in March, while consumer confidence hit its highest mark since the start of the pandemic. Measures of real-time consumer spending indicated a sharp acceleration in spending in the final weeks of March as stimulus checks made their way into consumers’ pockets. The trends pointed toward solid economic growth to end the first quarter and signaled strong momentum going into Q2, which will likely be the strongest quarter of growth this year. Fiscal support from the most recent stimulus package combined with the ongoing vaccination campaign and reopening process are all culminating to help lift estimated Q2 gross domestic product (GDP) growth to 9.3 percent (annualized) following what we estimate was 6.6 percent growth in Q1. The outlook this month includes for the first time the president’s $2 trillion infrastructure package, which is expected to influence government spending and thus overall GDP growth in H2 (second half).
With such a robust start to this year, we now expect GDP growth to rise 6.1 percent relative to last year. The upgraded outlook this month reflects the faster than expected rebound in hiring activity and surprising pace of consumer spending. Turning the page to 2022, more modest rates of growth are expected, with GDP growth rising 3.4 percent. The economy will continue to benefit, however, from both fiscal support and the eventual return of services spending, which will keep the rate of growth next year above its longer-run average.