November 1, 2021 — As we head into the holiday season, the economic uncertainty brought on by the pandemic continues to cloud the outlook for this year. In the first half of the year, U.S. economic growth was above average and consumer spending was robust as vaccination efforts coincided with a surge in consumer confidence. That story changed in the third quarter as COVID cases surged again, denting consumer confidence and dramatically slowing consumer spending.¹ We now expect consumer spending to rebound in the final months of the year, which should support solid holiday sales.
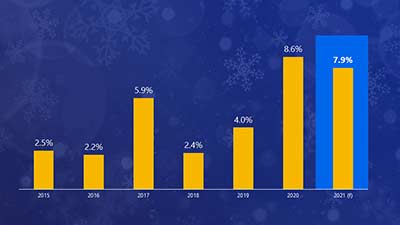
U.S. holiday spending* is likely to grow 7.9 percent year-over-year (YoY) on all forms of payment, according to Visa Business and Economic Insights. While this year’s forecast represents a downshift in sales over last year’s 8.6 percent (YoY) growth, it is still above the average rate of sales growth from 2010-2019 of 3.7 percent.² Among the key drivers of this year’s holiday sales outlook are continued strong e-commerce sales, robust demand for goods relative to services, and higher prices on holiday-related items. While this holiday shopping season is expected to be above average, there are risks; namely, the possibility of a surge in virus cases that could again dent consumer confidence and spending, and ongoing global supply chain disruptions, which could lead to a shortage of some holiday items. Absent these headwinds, the retail sector can expect another holly jolly holiday season.