July 9, 2020 – Economic data for the month of June continued to signal a rebound in economic activity even as the number of new virus cases continued to rise to new highs. Employers added 4.8 million jobs in June, taking unemployment down to 11.1 percent. The impressive net job growth figures stand in stark contrast to jobless claims, which continue to send misleading signals about the health of the labor market. Elsewhere, data on the business sector is also improving, with the Institute for Supply Management (ISM) non-manufacturing survey reaching a four-month high. As of June, both ISM measures were back above 50, signaling a return to expansion.
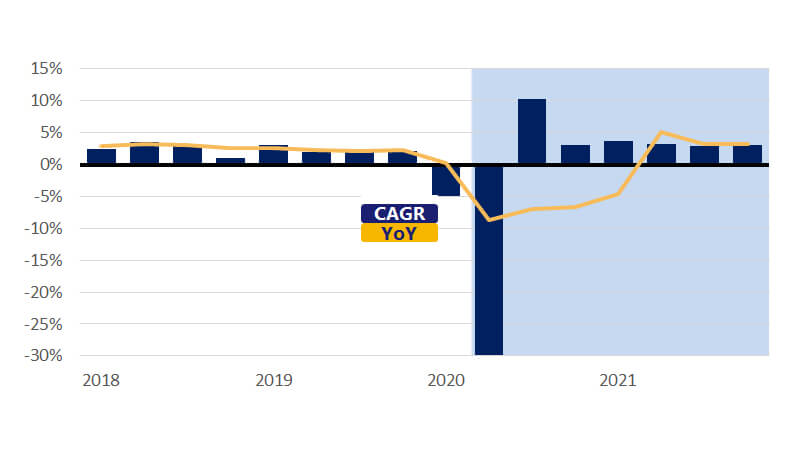
Our forecast is little changed since our June update but the downside risks to the outlook are clearly rising. We still see a continued recovery in the months ahead, albeit at a more gradual pace than June’s data would suggest. Our biggest concern remains around the public policy response to the recent surge in COVID cases. Should more wide-spread stay-at-home orders return, there could be considerable downside risk to our forecast. GDP growth is still expected to contract around 30 percent (annualized) in Q2 before growing 10.3 percent in Q3. Overall economic growth for 2020 is now expected to contract by 5.5 percent and rise 1.6 percent in 2021.
Highlights:
- Robust job gains continue
- Little change to the outlook this month
- Consumers are feeling confident again
- Concern is building over COVID surge