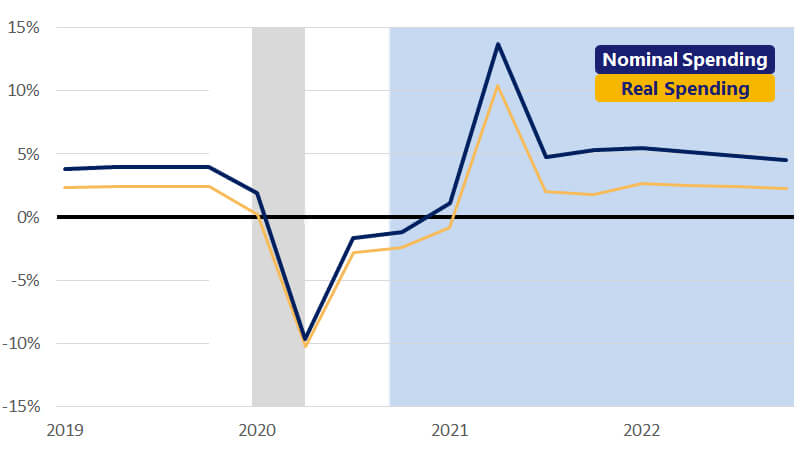
January 20, 2021 – As we start the new year, several key data points and events are influencing our forecast revisions this month. First, as a result of the Georgia Senate election run-off on January 5, Democrats will control both chambers of Congress and the White House; we had assumed Congress would be divided. For this reason, we have upwardly revised our estimate of gross domestic product (GDP) growth this year to reflect another round of fiscal stimulus (in addition to the package passed last month) and tax policy changes beginning in 2022. Outside of fiscal policy, the virus case surge and the adverse affects on growth and consumer spending have been far worse than we assumed. Consumer spending growth in Q4 of 2020 and Q1 of this year were revised downward as a result. Incoming economic data, including the December jobs report, reflected the quick loss of momentum in the economic recovery.
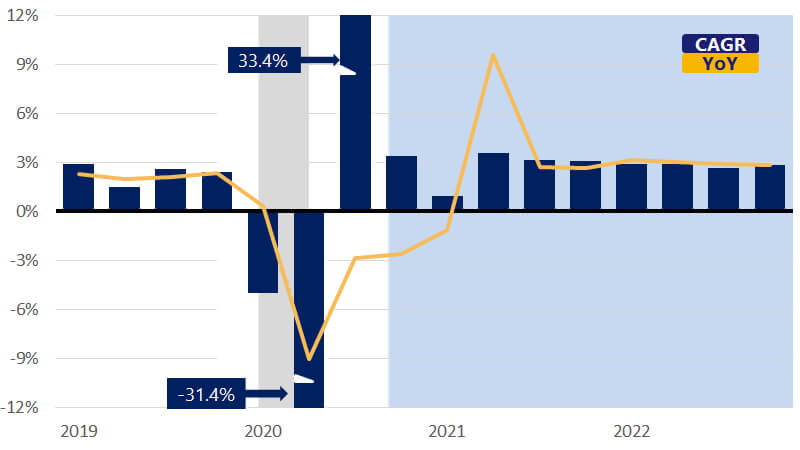
Now that the books are closed on 2020, we estimate fourth quarter GDP growth to be 3.4 percent (annualized). The loss of momentum in Q4 will translate into a softer 0.9 percent annualized rate of GDP growth for Q1, with real consumer spending contracting outright. Full-year GDP growth for this year is expected to rise 3.3 percent following an estimated 3.5 percent contraction in GDP growth in 2020. We continue to forecast stronger growth in the second half of this year as a vaccine becomes more widely available and consumer confidence begins to more meaningfully recover.