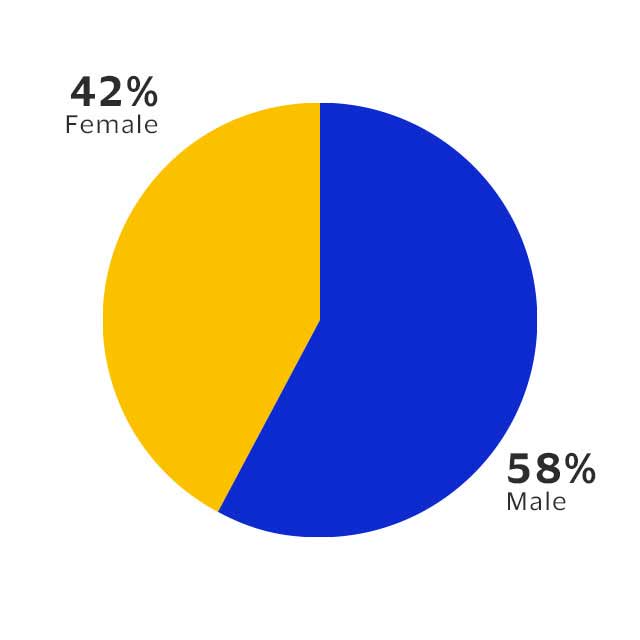
Gender in Global Workforce
Valuing the unique identities and contributions of all employees
Inclusion is a business imperative, from our workforce to the products we design and the businesses we serve.
An inclusive workplace is a key priority for us
Our inclusion strategy helps us all reach our full potential.
Inclusion is at the heart of everything we do
Our workforce
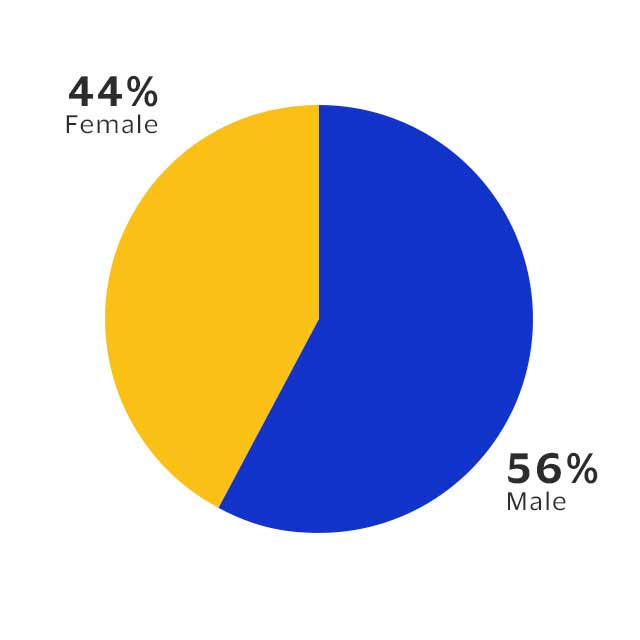
Gender in U.S. Workforce
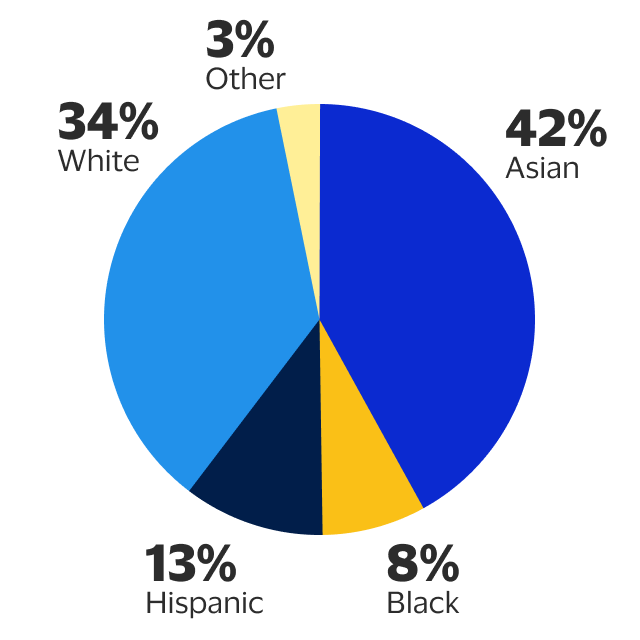
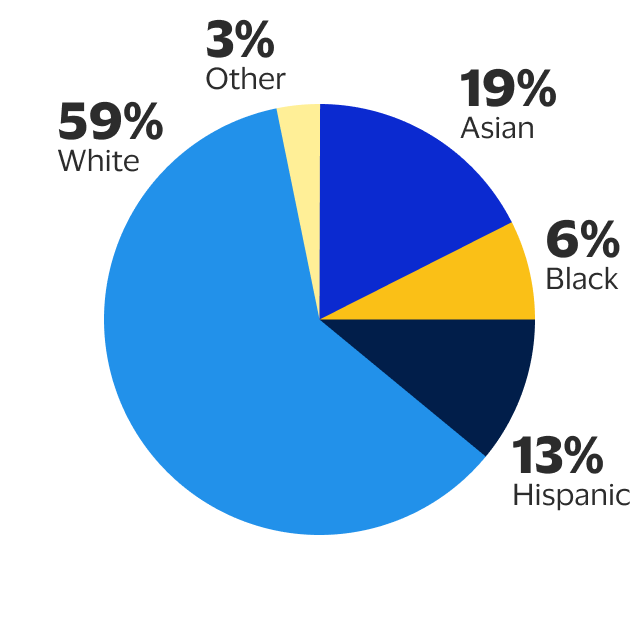
Ethnicities in U.S. Workforce
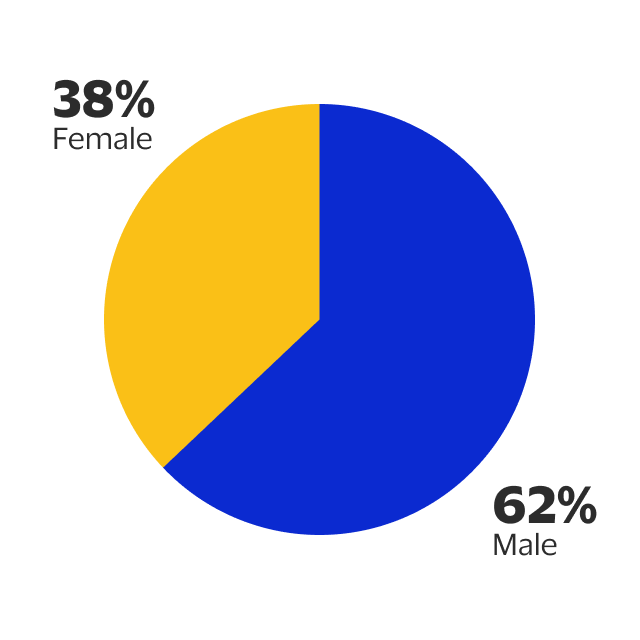
Gender in Global Leadership

Gender in U.S. Leadership
Ethnicities in U.S. Leadership
Footnotes
- Data is based on company records as of September 30, 2024.
- Leadership: VP and above.
- Others: American Indian/Alaska Native, Native Hawaiian/Other Pacific Islander and two or more races. Ethnicity data does not include undeclared and blanks.
- Equal pay analysis is based on FY24 total compensation, which includes base salary, annual cash incentives, and annual long-term incentive awards.
- Equal pay analysis includes 100% of all regular, active employees in a fully-integrated subsidiary as of September 30, 2024. Visa’s goal is to include 100% of regular, active employees in fully-integrated subsidiaries in this analysis.
- Underrepresented employees are Black/African American, Hispanic/Latinx, American Indian/Alaska Native, Native Hawaiian/Other Pacific Islander or two or more races.
- EEO-1: Most recently available certified EEO-1, posted on June 27, 2025.