2023 was the year of beach and business destinations, Visa estimates show

March 2024 – Data from Visa and the Visa International Travel platform¹ provide fresh insights into international travel and where people went in 2023. The data suggest three key trends in global travel:
- Global travel has become more concentrated, especially beach getaways. While international travel arrivals have almost fully recovered to their 2019 levels, recovery across destinations has varied. Of the top 1,000 most visited cities in 2019, only half fully recovered by 2023, suggesting that more people are crowding into fewer places. Sun and sand destinations in particular have outperformed, with a gain of 15 percent in international arrivals versus a loss of 3 percent for non-beach destinations since 2019.
- Business destinations are seeing a more broad-based recovery in travel spending. Analysis of depersonalized and anonymized transaction data shows that the share of Visa cards active in travel in 2023 was closer to 2019 shares for commercial rather than consumer cards. This broader basis for recovery has enabled business destinations to stage the second strongest recovery.
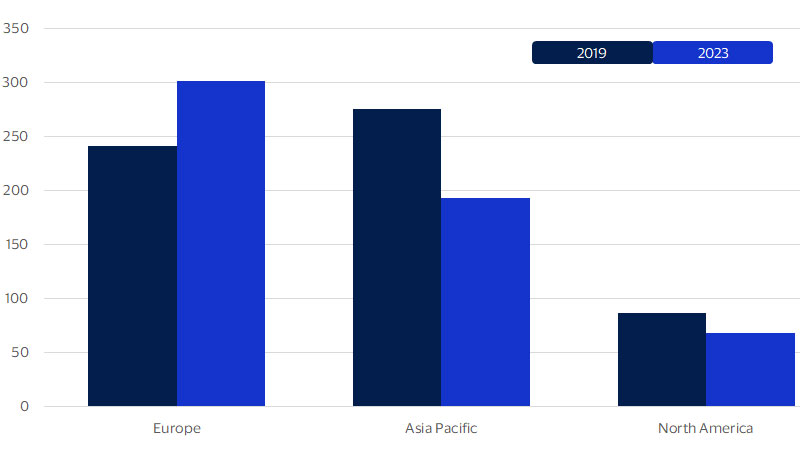
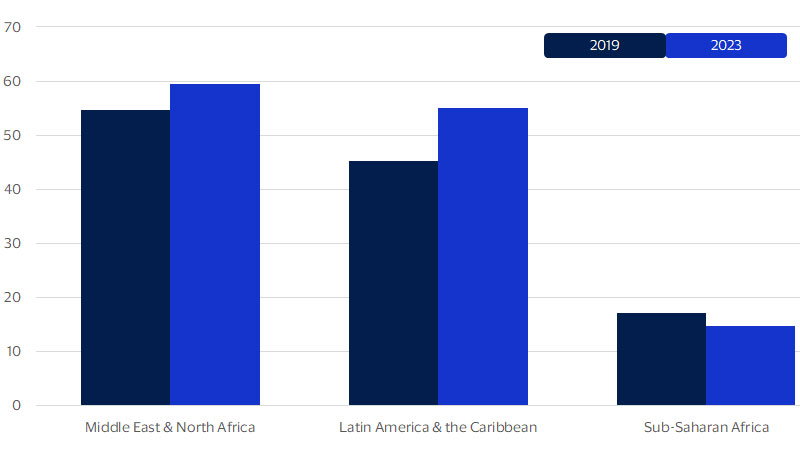
- Global travel recovery leaves room for more gains in arrivals and spending in 2024. Over 188 million more visits could occur in 2024 if travel to lagging destinations perks up, especially in Asia Pacific, North America and Africa. This could create opportunities for diversifying travel offerings and reducing the strain on more popular tourism spots, particularly in Europe.
International travel recovery leaves room for more gains in arrivals and spending in 2024
In 2023, the top 1,000 most-visited cities on the planet welcomed 1.2 billion foreign visitors,² marking a near-complete recovery in the volume of international visitor arrivals to its 2019 level.³
As the recovery strengthens, some aspects of travel have remained relatively unchanged, such as the cities that made the list in both years: nine out of 10 cities were in the top thousand in 2019 and in 2023. Similarly, the odds that a city in the top 25 list within its respective region in 2019 was also on that list in 2023 is somewhere between 84 to 92 percent.
Change, though, has come as the pace of recovery has varied across regions. The still-incomplete recovery in travel across key corridors—such as between the U.S. and Canada or Mainland China and the rest of Asia—means that 448 cities saw their relative global rankings fall by over 10 points since 2019. Over the same period, 433 cities saw gains of a similar magnitude, including new globe trekker favorites like Lisbon, Mecca and Punta Cana.
The top 25 cities in each region have remained nearly the same, but the recovery across regions has been uneven: Asia Pacific, North America and Africa are lagging while other regions lead
Cross-border visits to top 25 cities in each region, millions


High inflation boosted travel spending, but moderating prices should help broaden recovery to more cities
Global consumers spared no expense when indulging pent-up demand for international travel. Cross-border tourism spending recovered much more quickly than arrivals, with consumers prioritizing travel and other experiences despite surging price inflation globally over the past two years. In fact, travel spending by foreign visitors has already exceeded pre-pandemic levels in nine out of 10 destination cities in 2023, according to an analysis of depersonalized and anonymized transactions at merchants across 1,000 top destination cities globally.
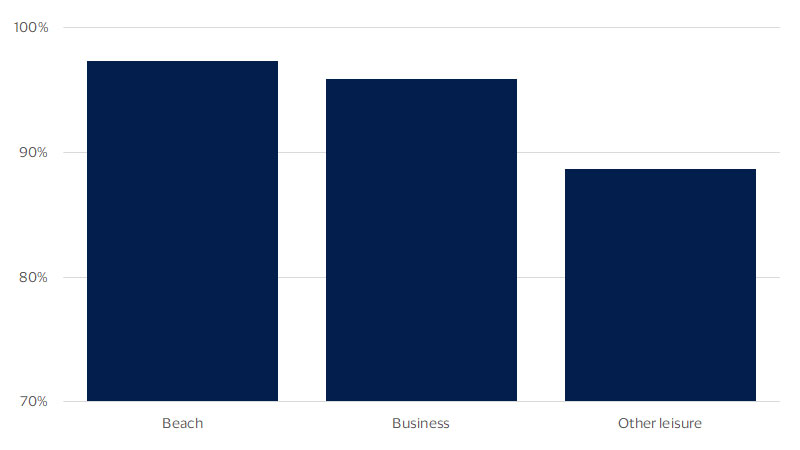
Travel spending recovery has been more prevalent in business rather than leisure destination cities.⁴ Even though overall global travel spending has strongly rebounded to 2019 levels, participation in leisure travel has been generally slower to return to its pre-pandemic norm compared to business travel. Analysis of depersonalized and anonymized transaction data shows that the share of Visa cards active in travel in 2023 was closer to 2019 shares for commercial rather than consumer cards, likely contributing to a relatively broader base of recovery in global travel to business destinations. Within leisure destinations, consumers maintained a strong preference for sun and beach vacations, helping contribute to full spending recovery in 97 percent of beach destinations covered.
Travel spending recovered in most destination cities, more so for sun and sand destinations
Cities where cross-border spending fully recovered in 2023 relative to 2019* (percent of cities)]

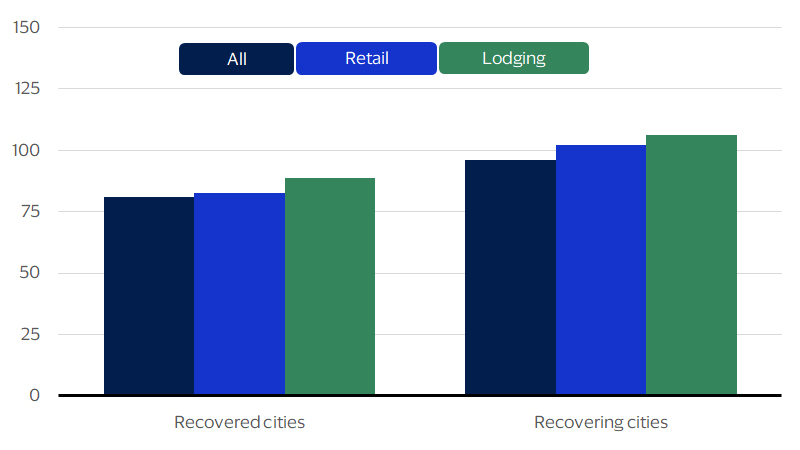
Higher costs held back some cities’ recovery—stronger growth expected as inflation retreats
Foreign visitors’ average spend per transaction by category: recovered vs. recovering cities, 2019 = 100

The world’s most visited cities in 2023
The post-pandemic recovery of the tourism industry has reshaped the preferences and behaviors of international travelers. In 2023, the top five destination cities for international tourist arrivals were Paris, London, Tokyo, Barcelona and Istanbul. In 2018, the top five were Paris, Tokyo, Bangkok, London and Barcelona. Post-pandemic, European cities gained popularity, claiming four spots among the top five.
Eight new cities from Europe, the Middle East, and Latin America entered the top 50 list, reflecting the growing popularity of diverse and emerging destinations. Meanwhile, some of the traditional hotspots in Asia and the U.S. experienced a decline in their positions, due to various factors such as the COVID-19 pandemic, travel restrictions, and the strong U.S. dollar. Read the full report for rankings of the world’s top cities for international arrivals in each region
Europe
2023 was a year of recovery for intra-Europe travel. The top five destination cities attracted 89 million travelers. European travel to Dubai and Bali recovered to pre-pandemic levels, while some other popular destinations, such as New York, Marrakech and Bangkok, remained below pre-pandemic figures.
Asia Pacific
Outbound travel from Asia Pacific is still below pre-pandemic levels, mainly due to travel restrictions and delayed reopenings of major markets. The most popular intra-regional destinations are still Tokyo and Bangkok, but inbound travel has been slower to recover. Bali, on the other hand, has seen an increase in travelers and surpassed its pre-COVID numbers.
North America
Among the top 10 destination cities for North American travelers, cities in Europe, Mexico, the Dominican Republic and Japan have recovered to pre-pandemic levels. Canadian cities, however, are still recovering in travel demand from North American travelers. Travel spend by North American travelers has surpassed 2019 levels.
Latin America and Caribbean
In 2018, most travelers from Latin America and the Caribbean preferred to visit destinations within their own region. However, by 2023, this trend changed significantly as more travelers opted for destinations outside of their region. Another shift in travel trends is the increased preference for cities in Europe over those in the U.S., apart from Miami.
Middle East and Africa
The pandemic has affected the preferences and patterns of intra-regional travel in the Middle East and Africa. Riyadh and Mecca have replaced Dubai and Johannesburg as the most popular destinations for travelers within the region in 2023. This shift is attributed to the significant investments that Saudi Arabia has made in its travel and tourism sector.
Footnotes
¹Based on Visa International Travel (VISIT) platform estimates. VISIT is a proprietary model that combines depersonalized and aggregated Visa cardholder data with publicly available cross-border arrival statistics. Visa uses this data to econometrically model official arrival statistics compiled by various government sources and to generate estimates that fill in the large gaps existing in the cross-border travel data. All analysis in this document excludes Russia and Ukraine.
²Based on Visa International Travel (VISIT) platform estimates. VISIT is a proprietary model that combines depersonalized and aggregated Visa cardholder data with publicly available cross-border arrival statistics. Visa uses this data to econometrically model official arrival statistics compiled by various government sources and to generate estimates that fill in the large gaps existing in the cross-border travel data. All analysis in this document excludes Russia and Ukraine.
³Visa Business and Economic Insights (Travel Insights Newsletter, April 2019). The world’s most visited cities in 2018. https://usa.visa.com/partner-with-us/visa-consulting-analytics/the-worlds-most-visited-cities-in-2018.html
⁴Based on depersonalized and aggregated transactions on Visa-branded credentials making card-present purchases at merchants located in cities outside the market where that credential was issued. Cities are classified as a business destination if the share of business travelers among visitors to the city places them within the top 30 percent of the peer group in 2019.
Forward-Looking Statements
This report may contain forward-looking statements within the meaning of the U.S. Private Securities Litigation Reform Act of 1995. These statements are generally identified by words such as “outlook”, “forecast”, “projected”, “could”, “expects”, “will” and other similar expressions. Examples of such forward-looking statements include, but are not limited to, statements we make about Visa’s business, economic outlooks, population expansion and analyses. All statements other than statements of historical fact could be forward-looking statements, which speak only as of the date they are made, are not guarantees of future performance and are subject to certain risks, uncertainties and other factors, many of which are beyond our control and are difficult to predict. We describe risks and uncertainties that could cause actual results to differ materially from those expressed in, or implied by, any of these forward-looking statements in our filings with the SEC. Except as required by law, we do not intend to update or revise any forward-looking statements as a result of new information, future events or otherwise.
Disclaimers
The views, opinions, and/or estimates, as the case may be (“views”), expressed herein are those of the Visa Business and Economic Insights team and do not necessarily reflect those of Visa executive management or other Visa employees and affiliates. This presentation and content, including estimated economic forecasts, statistics, and indexes are intended for informational purposes only and should not be relied upon for operational, marketing, legal, technical, tax, financial or other advice and do not in any way reflect actual or forecasted Visa operational or financial performance. Visa neither makes any warranty or representation as to the completeness or accuracy of the views contained herein, nor assumes any liability or responsibility that may result from reliance on such views. These views are often based on current market conditions and are subject to change without notice.
Visa’s team of economists provide business and economic insights with up-to-date analysis on the latest trends in consumer spending and payments. Sign up today to receive their regular updates automatically via email.