Economic outlook and forecasts Canada emerges from the crucible of policy shifts a more resilient economy

December 2025-Canada's economy has surged past its shaky 2025 start. It beat the odds stacked against it in a challenging year marked by global uncertainty and trade disruption, and is now on track to close the year with 1.7 percent real GDP growth. Looking ahead to 2026, growth is projected to remain steady, though at a slower pace of about 1.3 percent. In many ways, the economy is undergoing a transformation, much like what iron ore experiences when it becomes steel. The economy has gone through the crucible of trade shocks, creating a split structure: domestic services absorbed stress and held growth, while export‑exposed goods hardened and cracked at the edges. What’s in store for 2026 is further tempering as the economy is transformed by three fundamental changes.
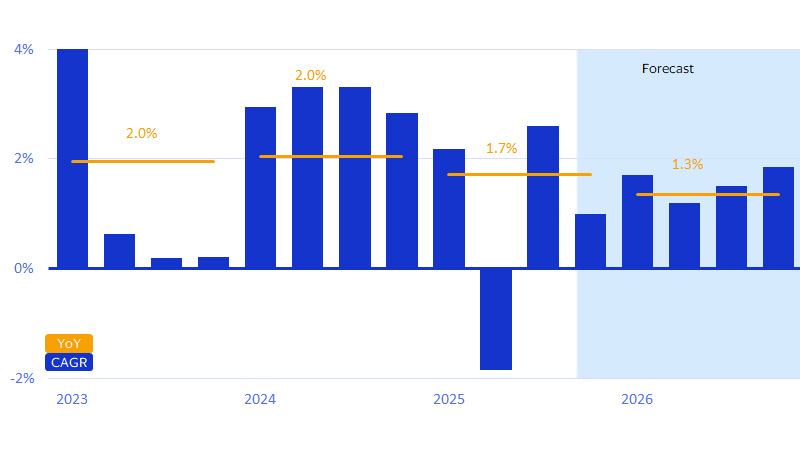
First, the recovery taking shape will be a continued tale of two economies: one domestic and resilient, the other trade-exposed and volatile. The economy that emerges on the other end should be a less brittle alloy, setting the stage for a return to trend growth by end of next year (see chart below).
Economic growth should stabilize and reaccelerate through end of 2026
(SA, CAGR and YoY* percent change)
Clearing the brush for future growth
If 2025 was a year of adjustment, 2026 is shaping up to be a year of rebuilding. Tariffs and trade friction are forcing a transformation of the Canadian economy with three long-term implications to its outlook: further reorientation of export lanes from trans-continental to trans-Atlantic; deeper entrenchment of the services industries taking over goods-producing sectors of the economy; and increased consolidation and concentration of economic activity among larger firms. All three changes should make the economy more resilient to shocks and set the stage for stronger productivity growth over the longer term.
Canadian exporters are responding by de-risking U.S. exposure and rerouting shipments toward other markets, mostly to Europe. Regardless of the outcome of trade negotiations with its southern neighbor, Canada’s strategic pivot toward diversification is already evident in the data and poised to deliver a sustained boost—not just to goods trade but also associated cross-border business travel and commercial payments. In fact, capital outlays on transportation infrastructure and establishing new supply chain linkages are expected to be one of the key drivers behind investment activity accelerating from estimated 1.2 percent growth this year to 2.2 percent in 2026, turning it into the primary driver of economic growth through and beyond the next year.
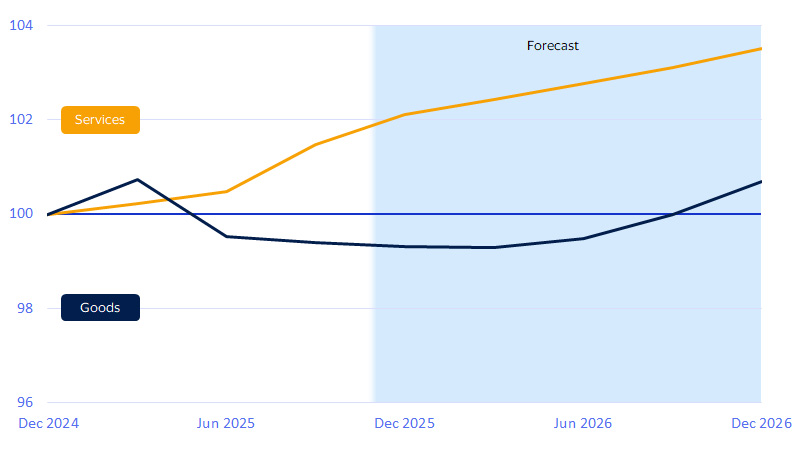
While the goods-producing sector of the economy is retooling, steadier growth in the services industries should increase its weight in Canada’s overall economy as a result (see chart below). One consequence of this economic rebalancing will be greater centralization of activity within larger firms. The compositional shift toward services alone can drive upward momentum in the average size of establishments, as smaller businesses remain more concentrated in the goods-producing sector of the Canadian economy. Moreover, smaller businesses have a limited capacity to absorb and adapt to unexpected shocks, making them more likely to close their doors. This trend is reflected in employment data (see chart in linked report), which shows steady job growth among larger establishments but concentrated job losses among smaller businesses.
This consolidation isn’t necessarily all bad news for the Canadian economy. In the short term, concentration of resources in larger firms can lead to more efficient use, helping offset external headwinds. Over the longer term, the exit of less productive firms paves the way for more innovative and efficient firms to emerge, helping jumpstart Canada’s productivity growth.
Goods-producing sectors are likely facing a lost year before the damage from trade disruptions clears
Gross value added by industry (Q4-2024 = 100)
Spending growth’s key engine under pressure
For years, Canada's consumer economy followed a simple formula: More people equals more spending. This was especially true in recent years, as immigration pushed population well above trend, accounting for over half of household expenditure growth at its peak—even while per-capita spending stagnated. That growth engine is now running out of fuel and shifting into reverse, with Statistics Canada projecting a population decline in 2026, the first in its recorded history.² This shift carries two important implications for Canadian businesses as they plan for the year ahead.
First, strategy might need to prioritize retention over acquisition next year. Consumer-facing businesses in Canada are likely to see revenues from their existing customer base stage a stronger recovery even while total sales are likely to continue feeling pressure (see chart in linked report). In fact, growth in spending per existing consumer is likely to rise in importance as the primary driver of sales in 2026.
When the population growth reverses, the impact won't be felt equally. Our analysis of historical spending data suggests that discretionary categories, such as hotels and restaurants, are more likely to face demographic headwinds in 2026, while essentials should prove more resilient (see chart in linked report).
Second, traditional measures of performance may need to be interpreted with greater care in business planning. The usual rules of thumb may no longer apply in an economy with a shrinking workforce. The unemployment rate, for instance, has likely already peaked even against the backdrop of a slowing labor market and will likely start declining in the first half of 2026.
With fewer working hands, the economy’s total productive capacity will diminish as well, with important implications for the likely path of monetary policy. Bank of Canada will be limited in its ability to stimulate the economy against such a supply-driven slowdown, as doing so would carry high risk of restoking price inflation. As a result, the policy rate is likely to remain at its current 2.25 percent level, keeping cost of borrowing for consumers (including mortgage rates) at a historically elevated level for the foreseeable future.³
Laying the foundation for the future of Canadian commerce
For many of our clients, the headlines and hype around AI can feel futuristic and disconnected from the immediate challenges of running a business and planning for the next fiscal year. Our unique analysis of transaction data shows that the future is already here, and adoption is accelerating fast enough that businesses should start developing a strategy now. Depersonalized and anonymized VisaNet data revealed two insights on Canada’s reaction to these emerging technologies and their implications for its short- to medium-term outlook.
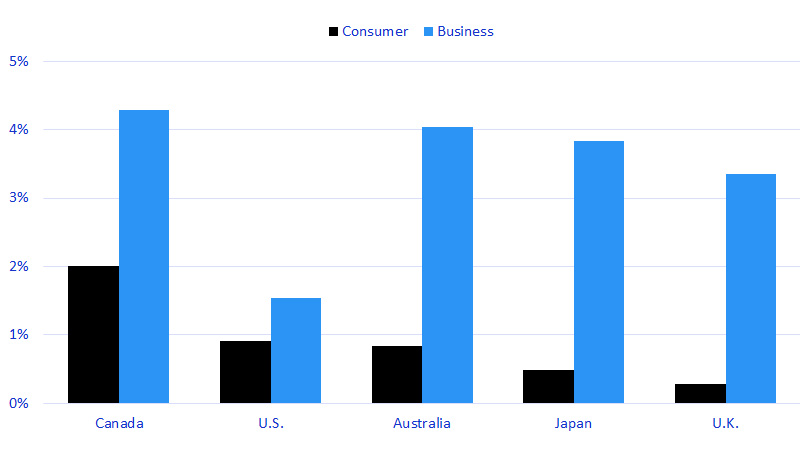
First, usage may only still be in the early stage of the adoption curve, but it is ramping up quickly both in Canada and globally. What may be overlooked is that Canadians are actually leading their peers in adoption rates (see chart below). History offers many examples where the greatest benefits of new technologies went not to their inventors, but to those who first identified and introduced innovative applications to market. What is quite indicative in this regard is the fact that the adoption rate is rising higher among businesses than consumers. What this means is that twice as many Canadian firms, proportionately, have already found enough of a use case for these emerging AI technologies that they are willingly paying to incorporate them into their business processes, and that’s not even accounting for the possibility that the technology has yet to reach its peak potential.
Canadian businesses are leading peers in the adoption rate of emerging AI technologies
Share of credit cards subscribed to GenAI services (Percent active, 12 months ending June 2025)
This brings us to our second insight: Spending and transaction growth among Canadian adopters has far outpaced peers who have yet to incorporate this business model, underscoring the potentially high return on investment from developing solutions for this rapidly growing segment (see chart in linked report).
As the Canadian economy faces demographic and geopolitical challenges in 2026, demand for technologies such as large language models and agentic AI commerce will only accelerate, offering tools to overcome these hurdles with greater efficiency and speed.
Footnotes
- Statistics Canada medium-growth population scenario.
- Elasticity estimates are based on quarterly Statistics Canada data from 2000 to 2025, excluding the COVID period.
- Visa Business and Economic Insights analysis of macroeconomic data and statements by Bank of Canada.
Forward-Looking Statements
This report may contain forward-looking statements within the meaning of the U.S. Private Securities Litigation Reform Act of 1995. These statements are generally identified by words such as “outlook,” “forecast,” “projected,” “could,” “expects,” “will” and other similar expressions. Examples of such forward-looking statements include, but are not limited to, statements we make about Visa’s business, economic outlooks, population expansion and analyses. All statements other than statements of historical fact could be forward-looking statements, which speak only as of the date they are made, are not guarantees of future performance and are subject to certain risks, uncertainties and other factors, many of which are beyond our control and are difficult to predict. We describe risks and uncertainties that could cause actual results to differ materially from those expressed in, or implied by, any of these forward-looking statements in our filings with the SEC. Except as required by law, we do not intend to update or revise any forward-looking statements as a result of new information, future events or otherwise.
Disclaimers
The views, opinions, and/or estimates, as the case may be (“views”), expressed herein are those of the Visa Business and Economic Insights team and do not necessarily reflect those of Visa executive management or other Visa employees and affiliates. This presentation and content, including estimated economic forecasts, statistics, and indexes are intended for informational purposes only and should not be relied upon for operational, marketing, legal, technical, tax, financial or other advice and do not in any way reflect actual or forecasted Visa operational or financial performance. Visa neither makes any warranty or representation as to the completeness or accuracy of the views contained herein, nor assumes any liability or responsibility that may result from reliance on such views. These views are often based on current market conditions and are subject to change without notice.
Visa’s team of economists provide business and economic insights with up-to-date analysis on the latest trends in consumer spending and payments. Sign up today to receive their regular updates automatically via email.