Demographics and technology to shape the future of global remittances

November 2024 – The future of remittances—money sent by migrant workers to families and friends back home—stands to be impacted by major demographic trends and technological shifts over the next decade. Understanding demographic shifts is crucial for anticipating changes in remittance flows, as population trends influence the number of migrants and their ability to send money home.
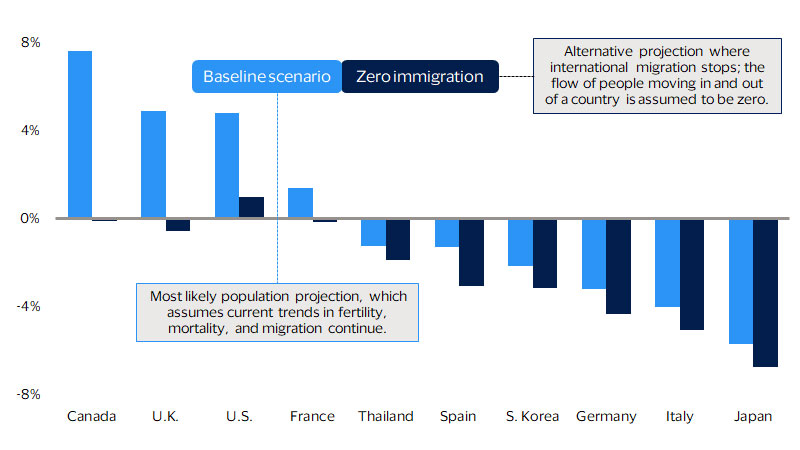
First, population decline and aging are beginning to strain key economies’ labor markets. According to recently updated United Nations estimates, populations have peaked in 63 countries and areas around the world.¹ Collectively, these areas generate over one-third of total global economic output. Over the next decade, populations could peak in 28 more countries, assuming no migration. Collectively, these 91 countries and areas account for four-fifths of today’s global economy. They will either depend more on immigration or their economic growth will fall or stagnate with fewer workers. The U.K. is a case in point. Its population could shrink by 410,000 if cross-border migration ends or could grow by 3 million under a baseline scenario, as set out in the UN’s medium variant (see figure below).
Migration flows have also changed over the course of the past couple of decades, with a considerable shift in the origin regions of international migrants and the destination regions. This directly impacts remittance flows, as money movement often follows people movement.
Lastly, the post-COVID leap in digitization, including in digital remittances, and better access to the internet and mobile connections around the world mean financial inclusion will continue to widen and more people will access these digital financial tools. The interplay between these three powerful forces will shape the future of the global remittance market.
Immigration is projected to play a key role in maintaining populations

Highlights:
- Immigration can fill gaps left by population aging
- Origin and destination regions for international migrants have shifted over time
- Money movement followed people movement
- The rise of the ‘alternative dream’ and non-Western economic opportunities
- Digitization facilitates money movement and widens access and financial inclusion
Immigration can fill gaps left by population aging
Demographers have long expected declining fertility rates would eventually lead to a peak in the world’s population. With a very high probability, the UN has now moved forward that date to 2084.² More importantly for the economy and future of consumption, the date at which the working age population peaks globally (defined as those aged 25-64) is projected to be 2070, a full 14 years earlier. This earlier peak is due to lengthening lifespans offsetting the impact of declining fertility but contributing to population aging. Economic theory holds that shrinking working-age populations without productivity gains should lead directly to lower overall economic output and stagnant-to-falling economic growth. Moreover, as the number of workers relative to the rest of the population (either the retired or young) falls, this too will put pressure on the economy to supply the output needed to support current levels of demand. Either labor increases or consumption falls in such a scenario.
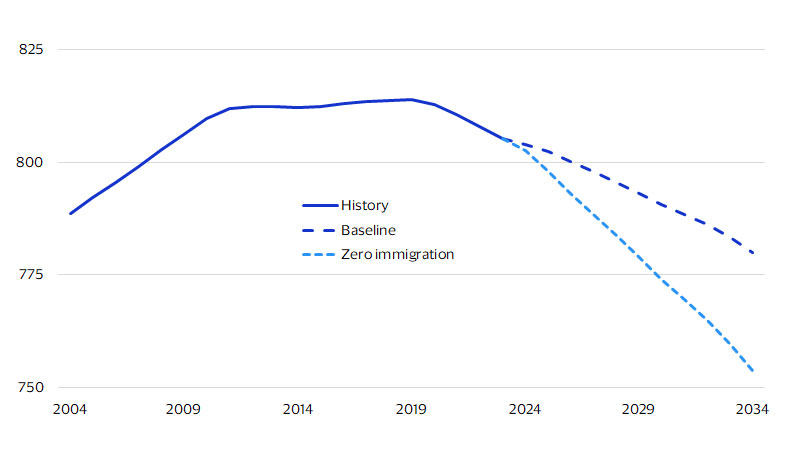
To get a better sense of the importance that immigration could play for the global economy, consider again the 91 countries and areas where the population has peaked or will peak. Net immigration is projected to cushion the fall in labor forces in 44 of them. Countries on this list include Canada, Germany, Italy, Japan, Korea, Sweden, Thailand, the U.K, and the U.S., which together account for three quarters of the world’s total output, or GDP. Even under the baseline scenario, these countries will see their labor force shrink by 25 million over the next 10 years. Losing that many workers at today’s labor productivity rates means an economy the size of Spain could disappear by 2034.
Under the no immigration scenario, the labor force shrinks by 52 million and the world loses an economy the size of Germany. The gap between the zero migration and baseline projections means that immigration leads to these economies having 26 million more workers in 2034 than the natural rate of increase of their population can support—enough workers to power an economy the size of Italy’s.
Over the next decade to 2034, the number of working-age and non-working age migrants to these countries is projected to reach 31 million under the median variant. In the prior decade, 36 million migrants reached their shores and, given the resistance that level of migration caused, it remains to be seen whether societies and governments will retain the will to absorb another immigration wave of this size.
Where these future migrants will come from is also in flux. Between 2010 and 2022—when the world’s population reached 8 billion—almost 620 million working-age people joined the labour market. Of those 620 million people, 43 percent came from Asia Pacific, 32 percent from Africa, and 25 percent from other regions. By the time the global population hits 9 billion—a milestone expected to be reached by 2037—slightly over 600 million will become part of the working age population, with a staggering 57 percent of them coming from Africa, 17 percent from Asia Pacific and 26 percent from other regions.⁴
Without immigration, labor force shrinks faster
Labor force in 44 countries under two scenarios (millions)³

Origin and destination regions for international migrants have shifted over time
The dynamics of migrations and people movement have changed over the past three decades, driven by political and economic developments across different regions. In 1990, Europe, Asia Pacific and North America were the top destinations for international migrants, accounting for 32 percent, 18.8 percent and 18 percent of total international migrants, respectively. Fast forward to 2020 and the picture looked slightly different; while Europe and North America remained quite popular with international migrants, MENA muscled in and displaced Asia Pacific among the top three destination regions.⁵ Strong economic growth, oil windfalls and substantial government spending and investment in infrastructure, notably in the economic powerhouses of the region, Saudi Arabia and the U.A.E., as well as the Gulf Cooperation Council (GCC) states in general, attracted an increasing share of global migrants looking for better economic opportunities.
As a result, the share of international migrants heading to MENA increased by 5 percentage points, rising from 13.5 percent in 1990 to 18.5 percent in 2020, while the share heading to Europe and North America remained somewhat stable around 30 percent and 20 percent, respectively.
On the flip side, when examining international migrants by regional origin, the overall shares for North America, Asia Pacific and Sub-Saharan Africa remained relatively stable over the past three decades. Europe experienced the largest shift, with the share of migrants dropping from 31.2 percent in 1990 to 22.5 percent in 2020, as economic prosperity and political stability settled in, with a few exceptions. Migrants from Latin America and MENA accounted for 15.3 percent and 12.7 percent of total international migration, respectively.⁶
Money movement followed people movement
Concurrently, development in remittance flows followed changes in migration trends over the past two decades and the rise of several emerging markets as global economic centers. After all, remittance outflows from a certain country correlate to some extent, though not entirely, with the country’s global economic standing, labor market opportunities and its level of attractiveness for migrant workers.
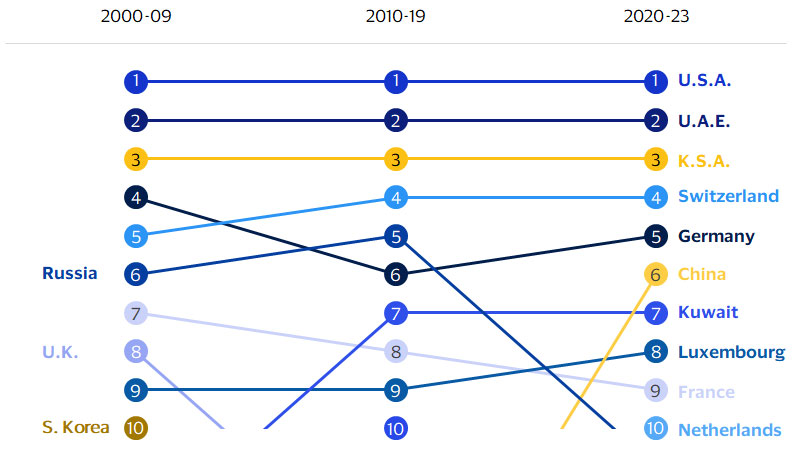
Looking back at the past couple of decades, the list of top countries sending remittances was dominated by developed Western economies, including the U.S., Switzerland, Germany, United Kingdom, France and Luxembourg. While many Western economies continued to play a vital role in the outward remittance market in the 2020s, several countries made notable strides in topping the global rank, including the U.A.E., China and Kuwait, reflecting growing economic clout, increasing labor market opportunities and openness to migrant workers.
New entrants emerged as top countries for sending remittances over the past decade
The top 10 sources of remittance outflows over the past couple of decades, ranking

A number of these emerging economies are expected to retain their position as top sources of global remittances over the next decade, and the flow of migrants and skilled workers to these emerging markets is likely to continue as their economies continue to prosper and expand. Several reforms and easing of visa policies, such as the streamlined electronic visa in Saudi Arabia and the long-term Golden Visa in the U.A.E., are likely to attract even more skilled workers to the region, further consolidating these markets as key sources for global remittances.
In terms of changing inflows, a number of key economies on the top 10 list for receiving international remittances in the 2000s, including Poland and the U.K., had disappeared by 2020. Emerging markets in Asia have dominated the list in recent years. The trend of remittance inflows more or less reflects again the changes in people flows by country of origin and destination.
The rise of the ‘alternative dream’ and non-Western economic opportunities
In the early 1990s, the ‘American dream’ was quite alive and Western economic powerhouses were the most popular destinations for migrant workers. By the turn of the millennium, the rise of other emerging markets presented key alternative opportunities for expatriate workers.
One country that captures this shift in people flows and migration over the past three decades is India— the top source market globally for migrants, with 18 million people living abroad in 2020. While GCC states have historically been popular destinations for Indian migrants looking for employment and better economic opportunities, in more recent years there has been a notable pick up in the influx of Indian migrants to these locations, outranking traditionally popular destinations such as the U.K., Canada and Australia.
By 2020, the U.A.E. ranked as the top destination for Indian migrants at almost 3.5 million, followed by the U.S.A and K.S.A. Interestingly as well, Oman made significant gains, rising from the eighth top destination for Indian migrants in 1990 to the fifth in 2020.
Indian migrants increasingly head to GCC countries for a variety of economic, social and cultural reasons. Economic opportunities, especially in sectors like construction, healthcare, and IT, are the primary drivers, with most positions in these countries offering higher salaries compared to similar roles in India. The geographical proximity of GCC countries to India and the historical presence of large Indian expatriate communities provide social and cultural comfort as well. Additionally, the immigration process for expatriate workers to GCC countries is typically more open compared to other advanced economies. These key factors collectively reinforce the rising migration trend from India to GCC countries.
Digitization facilitates money movement and widens access and financial inclusion
The other critical factor reshaping the international remittance market and will play a key role in its future is the rise of digital remittances, or funds that are sent and received online through web, mobile, digital apps, etc. Digital remittances rose from 25.5 percent of total remittances in Q2-2016 to 56.7 percent in Q3-2022. This was facilitated by the surge in smartphone adoption and app-based digital payments, which are often easier to use and have very low barriers for usage.
The rise of internet adoption and mobile subscriptions around the world laid the foundation for the boom in digital remittances. By 2022, 66 percent of the global population had access to broadband internet and 68 percent to smartphones. And, just as the pandemic caused a leap in e-commerce and compressed years’ worth of digital transformation, remittances witnessed a similar profound shift, with more and more money sent now through digital channels. This trend will likely accelerate further over the coming decade, as internet and mobile penetrations rise further and financial inclusion widens, fueling growth in money movement and remittances.
A recent study by Visa found 53 percent of consumers are turning to digital apps to send and receive funds around the world.⁷ Digital options for sending and receiving money are often more convenient for consumers, offering a wide variety of advantages, including speed, easy tracking, and a higher level of security. They are also often cheaper than sending remittances the traditional way. The World Bank’s latest remittance report, which tracks the cost of sending US$200 across all geographic locations, shows that sending a typical US$200 remittance in cash cost on average 6.8 percent in Q1-2024. By comparison, it cost 5.4 percent for mobile money and 5.1 percent for debit or credit card.⁸
Digital remittances now make up more than half of the global remittance market
Distribution of global remittances by transfer type, percent of total

Footnotes
- United Nations Department of Economic and Social Affairs, Population Division (2024). World Population Prospects 2024: Summary of Results (UN DESA/POP/2024/TR/NO. 9).
- United Nations Department of Economic and Social Affairs, Population Division (2024). World Population Prospects 2024: Summary of Results (UN DESA/POP/2024/TR/NO. 9).
- The 44 countries with populations peaking before 2034 and who are projected to benefit from immigration flows are: Andorra, Aruba, Austria, Bahamas, Belgium, Bonaire, Sint Eustatius and Saba, British Virgin Islands, Canada, Macao SAR, Curacao, Cyprus, Denmark, Finland, France, Georgia, Germany, Guernsey, Holy See, Hungary, Isle of Man, Italy, Japan, Jersey, Liechtenstein, Luxembourg, Malta, Monaco, Netherlands, Norway, Portugal, Russia, St. Barthelemy, St. Kitts and Nevis, San Mario, Sint Maarten, Slovenia, South Korea, Spain, Sweden, Switzerland, Thailand, Ukraine, United Kingdom, United States of America.
- United Nations Department of Economic and Social Affairs, Population Division (2024). World Population Prospects 2024: Summary of Results (UN DESA/POP/2024/TR/NO. 9).
- United Nations Department of Economic and Social Affairs: https://www.un.org/development/desa/pd/content/international-migrant-stock
- United Nations Department of Economic and Social Affairs: https://www.un.org/development/desa/pd/content/international-migrant-stock
- Visa Money Travels: 2023 Digital Remittances Adoption
- World Bank. (2023). An Analysis of Trends in cost of remittance services remittance prices worldwide quarterly (Issue 49). World Bank Publications.
Forward-Looking Statements
This report may contain forward-looking statements within the meaning of the U.S. Private Securities Litigation Reform Act of 1995. These statements are generally identified by words such as “outlook”, “forecast”, “projected”, “could”, “expects”, “will” and other similar expressions. Examples of such forward-looking statements include, but are not limited to, statements we make about Visa’s business, economic outlooks, population expansion and analyses. All statements other than statements of historical fact could be forward-looking statements, which speak only as of the date they are made, are not guarantees of future performance and are subject to certain risks, uncertainties and other factors, many of which are beyond our control and are difficult to predict. We describe risks and uncertainties that could cause actual results to differ materially from those expressed in, or implied by, any of these forward-looking statements in our filings with the SEC. Except as required by law, we do not intend to update or revise any forward-looking statements as a result of new information, future events or otherwise.
Disclaimers
The views, opinions, and/or estimates, as the case may be (“views”), expressed herein are those of the Visa Business and Economic Insights team and do not necessarily reflect those of Visa executive management or other Visa employees and affiliates. This presentation and content, including estimated economic forecasts, statistics, and indexes are intended for informational purposes only and should not be relied upon for operational, marketing, legal, technical, tax, financial or other advice and do not in any way reflect actual or forecasted Visa operational or financial performance. Visa neither makes any warranty or representation as to the completeness or accuracy of the views contained herein, nor assumes any liability or responsibility that may result from reliance on such views. These views are often based on current market conditions and are subject to change without notice.
Visa’s team of economists provide business and economic insights with up-to-date analysis on the latest trends in consumer spending and payments. Sign up today to receive their regular updates automatically via email.