Electric vehicles are transforming mobility, economies and payments

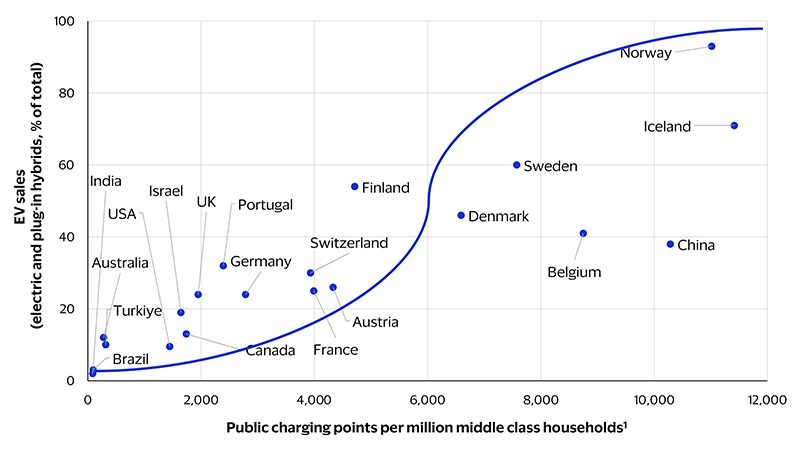
December 2024 - While the journey toward reducing carbon emissions from transportation has taken a few detours, the world is still heading toward a future in which electric vehicles (EVs) will reshape personal mobility. In 2023, EV sales accounted for at least half of all new cars sold in key Nordic countries (see figure below), a milestone China also reached in mid-2024. If current projections and public commitments hold, the rest of the world could cross the same threshold by 2030, aided by an expanding network of public chargers.
More than simply a technological shift, EVs represent a transformative economic force. Anonymized transaction data from VisaNet reveals that multi-car households with EVs spend 28 percent less on gasoline and are less sensitive to fluctuations in gasoline prices. Furthermore, businesses located near chargers enjoy higher sales than those farther away, with grocery stores and restaurants benefiting the most. Viewed from a broader lens, EVs are becoming an economical option for younger consumers with the means in emerging economies, where innovative financial and subscription models are reducing upfront costs.
As countries around the world roll back consumer subsidies for EVs, further EV adoption will depend more on delivering a better consumer experience and value. Efficient and user-friendly payment solutions can play a critical role in this next phase of the industry’s development. A frictionless payment approach based on an open-loop system, where a single bank-issued card can be used for all payments—whether contactless or card-on-file—could streamline transactions and enhance the charging experience.
EV adoption is poised for exponential growth in most economies
Percent share of electric car sales vs. availability of EV public charging points¹ in 2023
EVs are reshaping middle-class living
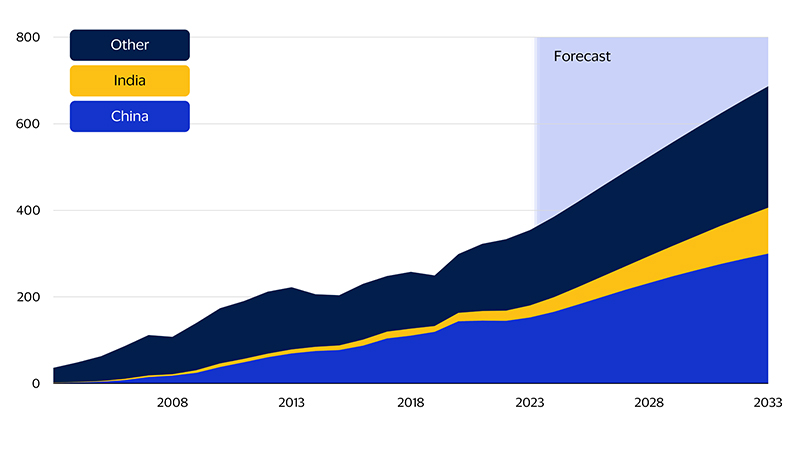
The emerging market middle class* will double in the next decade
Millions of households
Among emerging markets, China is the leader in auto sales, with Chinese domestic new car sales exceeding new car sales in the EU and the U.S. combined since 2021.² Auto industry trends are now set in China, and the country’s future is electric. As of June 2024, half of all new cars sold in China are now EVs, according to data from the China Passenger Car Association. This could rise to nearly 70 percent by 2030, based on earlier forecasts from the International Energy Agency (IEA).
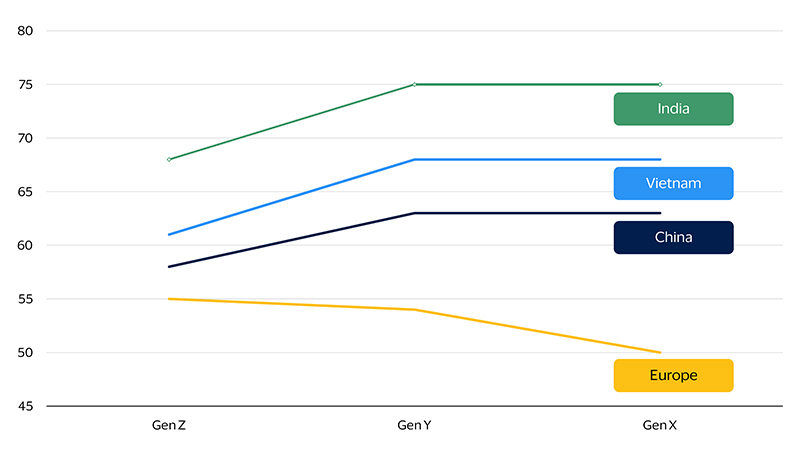
Younger consumers who can afford cars in emerging economies are increasingly considering EVs, thanks to subscription models that lower the costs over the long-run. Consumers, particularly in emerging economies where EVs are made locally and cheaper, are more inclined to buy electric cars. Further, there is a growing eco-friendly mindset. Over half of those who can afford them agree that electric cars are the motor industry's future (see figure below). Consequently, this could lead to strong demand for electric cars in emerging markets, where they might be the first choice for young buyers.
Alongside rising demand, the private sector is swiftly building supply side infrastructure, such as battery swapping systems and charging stations, to enhance the ease and convenience of owning an electric vehicle. Already, emerging markets like India are witnessing record EV sales. India is arguably the most innovative market for affordable electric vehicles that have reached the tipping point of cost and convenience. India's EV policy has incentivized more charging stations, resulting in faster growth in electric car sales compared to the global average (71 percent vs. 35 percent in 2023). Moreover, India’s battery-as-a-service model facilitates quick battery swaps, similar to traditional refueling times, that enable EV drivers to save time and travel longer distances. Drivers pay a periodic subscription fee to battery service providers over the vehicle’s lifespan. This subscription model separates battery costs from the price of the vehicle, further encouraging EV adoption. As electric cars approach price parity with traditional internal combustion engine (ICE) cars and charging points become more widespread, other countries are likely to see similar exponential growth in EV adoption.
Electric cars are the future of the motor industry in emerging markets
Adult respondents of medium-to-high income or wealth who agree with the statement as a share of total (percent)
EV charging stations benefit businesses in the vicinity
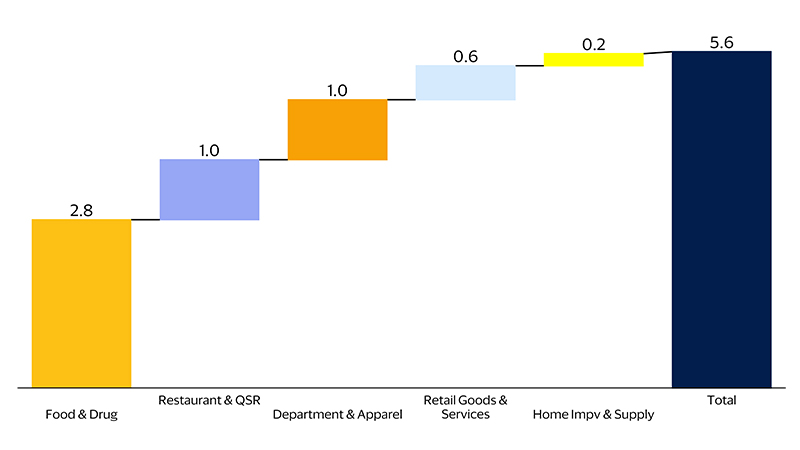
As charging networks continue to expand, consumer spending is shifting toward areas with chargers. Merchants near new charging locations saw a boost in sales with each opening from 2022 to 2023, according to analysis of data from VisaNet and the U.S. Department of Energy. Within the first 90 days of a charging location’s opening, spending at merchants within a half-mile radius increased by 2 percent—equal to 17 more transactions per day.
The charging stations in this analysis were in areas with an average of six restaurants and four grocery stores or pharmacies, which are also the types of merchants that see the greatest lift. Food and drug retailers, for example, saw nearly three more transactions per day, per merchant with the opening of a new charger, followed by restaurants (both full and quick-service) (see figure below).
This shift suggests that a significant number of EV drivers are shopping at nearby merchants before, during or after charging their EVs, and potentially selecting merchants based on their proximity to EV chargers. Additionally, it largely reflects spending by affluent homeowners—the largest group that spends on EV charging—as well as by frugal renters, who over-index on spend per average card for EV charging transactions relative to other segments.³
Merchants within a half-mile (0.8 km) radius of EV charging stations display a lift in sales
Average transaction lift per merchant per day
EVs lead to more stable consumption patterns
For consumers, greater EV adoption could buffer their spending from swings in oil markets, leading to more stable spending through commodity cycles. In many markets, motor fuel accounts for the largest cost of operating personal transport. These costs in turn represent between 4.6 percent and 6.2 percent of total consumer spending in emerging markets and advanced economies, respectively. Research has shown that oil prices can have an even greater impact on consumer spending. For example, the sharp rise in gasoline prices in 2022 may have added further fuel to the spike in consumer prices by boosting inflation expectations,⁴ and elevated gas prices in 2007 could have contributed to the U.S. housing and financial crisis by putting further strain on already financially stressed households.
Even in countries where EV adoption is still in its early stages, such as the U.S., oil prices’ impact on consumption is weakening. U.S. EV-owning households tend to be in the top third by income and own multiple cars, according to our analysis of anonymized transaction data.⁵ As the top third of U.S. households account for over 45 percent of all gasoline spending, changes in their spending patterns could impact aggregate gasoline consumption. In fact, analysis of transaction data shows that only 1 in 5 households matching the consumer profile of an EV owner actually owns one, suggesting significant growth potential. On average, multi-car households with EVs save $325 a year on gasoline. They also have slightly more flexibility to reduce spending during oil price increases. For every 10 percent increase in gasoline prices, EV owners cut their gasoline spending by 1 percentage point more than their non-EV counterparts.
Removing “speed bumps” on the road to EV adoption
By 2023, nearly 14 million EVs were sold annually, representing an average annual growth rate of 57 percent over the past decade. Over the next decade, maintaining this sales growth faces new speed bumps, as governments end economic incentives to promote greater EV adoption. Already, Sweden has stopped providing incentives for EV purchases as of 2022.⁶ Norway and Germany reduced their incentives in 2023, and, following its recent presidential election, the U.S. is widely expected to follow suit.7,8 How far a country is along the EV adoption curve could determine the impact of these policy changes. For example, some studies suggest that the U.S. market is approaching the tipping point where consumers’ increased acceptance of EVs and expansion of the charging infrastructure could be enough to sustain EV adoption if subsidies are pulled.9,10,11 Our research, though, shows that EV adoption is still largely limited to early adopters and has not yet developed mass appeal.
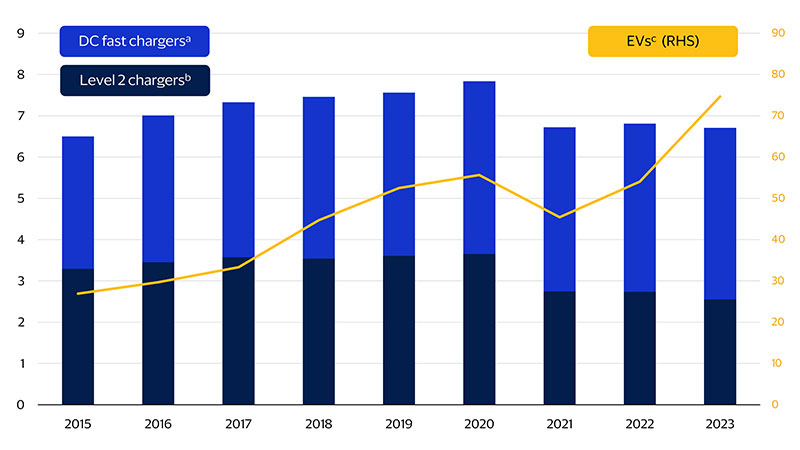
Although EV charging primarily takes place at home, access to external charging points will play a key role in further EV adoption. In the U.S., for instance, the number of DC fast-chargers per charging location increased from 3 to 4 between 2015 and 2023, but EV growth during the same period far outpaced it: The number of EVs per charging location jumped from about 27 in 2015 to 75 in 2023 (see figure below). Meanwhile, governments are examining not only the availability of public charging stations, but also how convenient they are. For instance, the EU is developing a competitive market with open access to all parties interested in establishing and operating charging points to address the uneven distribution of public charging infrastructure.¹²
While more EV chargers will help, enabling more convenient payments for charging could also accelerate adoption. Currently, drivers must register with multiple EV charging networks, making the process cumbersome. Unlike refueling, EV charging often involves special apps or cards and lengthy registrations. This issue can be addressed through open-loop payments, which allow the use of regular cards or digital wallets without additional steps such as logging into a mobile app or using a proprietary RFID card or dongle. This system would simplify transactions and eliminate the need for proprietary cards. Already, new regulations require public charging points in EU countries to be digitally connected, meaning they can send and receive real-time information with the electricity grid and vehicles. This enables the development of interoperable payment solutions and enhances the charging experience for operators and drivers.¹³
Growth in electric cars exceeds the rise in charging locations
Number of chargers, electric cars per charging location
Footnotes
- Data on public charging points is extracted from IEA (2024), Global EV Outlook 2024, IEA, Paris https://www.iea.org/reports/global-ev-outlook-2024, License: CC BY 4.0. The deployment of public charging infrastructure in anticipation of increasing EV sales is essential for widespread EV adoption. Data on the size of middle-class households is from Oxford Economics. Middle class households are defined as those earning between $20,000 to $70,000 annually on a purchasing power parity-adjusted basis in constant 2015 U.S. dollars.
- Visa Business and Economic Insights analysis of data from the International Organization of Motor Vehicle Manufacturers/Haver Analytics.
- Visa Consulting & Analytics, “Harnessing payments opportunities in the age of electric vehicles,” 2024.
- Nide Cakr Melek, Francis M. Dillon, and A. Lee Smith, “Can Higher Gasoline Prices Set Off an Inflationary Spiral?” Economic Review, Federal Reserve Bank of Kansas, 2022.
- EV owners were identified as those who transacted at a public EV charging station between 2020 to 2023, and the non-EV control group was based on consumers who shared similar characteristics but who did not transact at a public EV charging station during this timeframe.
- https://www.regeringen.se/artiklar/2022/11/fragor-och-svar-om-avskaffad-klimatbonus/
- https://www.bmwk.de/Redaktion/DE/Pressemitteilungen/2023/12/20231216-umweltbonus-endet-mit-ablauf-des-17-dezember-2023.html
- https://elbil.no/english/norwegian-ev-policy/
- Archsmith, James E, Erich Muehlegger, and David S Rapson, “Future paths of electric vehicle adoption in the United States: Predictable determinants, obstacles and opportunities,” Environmental and Energy Policy and the Economy, 2021, 3(1), 71-110
- Rapson, D.S.; Muehlegger, E. “The Economics of Electric Vehicles”; Working Paper 29093; National Bureau of Economic Research: Cambridge, MA, USA, 2021
- Gillingham, Kenneth T., Arthur A. van Benthem, Stephanie Weber, Mohamed Ali Saafi, and Xin He. "Has Consumer Acceptance of Electric Vehicles Been Increasing? Evidence from Microdata on Every New Vehicle Sale in the United States." AEA Papers and Proceedings, 2023, 113: 329–35
- Regulation (EU) 2023/1804 of the European Parliament and of the Council of 13 September 2023 on the deployment of alternative fuels infrastructure, and repealing Directive 2014/94/EU, 2023
- Regulation (EU) 2023/1804 of the European Parliament and of the Council of 13 September 2023 on the deployment of alternative fuels infrastructure, and repealing Directive 2014/94/EU, 2023
Forward-Looking Statements
This report may contain forward-looking statements within the meaning of the U.S. Private Securities Litigation Reform Act of 1995. These statements are generally identified by words such as “outlook”, “forecast”, “projected”, “could”, “expects”, “will” and other similar expressions. Examples of such forward-looking statements include, but are not limited to, statements we make about Visa’s business, economic outlooks, population expansion and analyses. All statements other than statements of historical fact could be forward-looking statements, which speak only as of the date they are made, are not guarantees of future performance and are subject to certain risks, uncertainties and other factors, many of which are beyond our control and are difficult to predict. We describe risks and uncertainties that could cause actual results to differ materially from those expressed in, or implied by, any of these forward-looking statements in our filings with the SEC. Except as required by law, we do not intend to update or revise any forward-looking statements as a result of new information, future events or otherwise.
Disclaimers
The views, opinions, and/or estimates, as the case may be (“views”), expressed herein are those of the Visa Business and Economic Insights team and do not necessarily reflect those of Visa executive management or other Visa employees and affiliates. This presentation and content, including estimated economic forecasts, statistics, and indexes are intended for informational purposes only and should not be relied upon for operational, marketing, legal, technical, tax, financial or other advice and do not in any way reflect actual or forecasted Visa operational or financial performance. Visa neither makes any warranty or representation as to the completeness or accuracy of the views contained herein, nor assumes any liability or responsibility that may result from reliance on such views. These views are often based on current market conditions and are subject to change without notice.
Visa’s team of economists provide business and economic insights with up-to-date analysis on the latest trends in consumer spending and payments. Sign up today to receive their regular updates automatically via email.