Global travel is slowing down... in a good way

October 2024 – A popular travel quote says the world is a book and those who don’t travel read only one page. It seems today, those who travel not only read more pages by traveling more often, but they’re also mindfully turning the pages more slowly, savoring their travel experience and ushering in the global rise of slow travel. The novel trend reflects the tendency of leisure travelers to take longer-duration holidays, explore off-the-beaten-path destinations, and value more immersive experiences by connecting with the local culture, environment and people. More people are also now combining leisure with business travel or living and working remotely in another country—so called ‘digital nomads’—for extended periods of time. These new forms of ‘slow travel’ stand in contrast with some of the more traditional forms of travel, centered around crowded tourist hotspots and jam-packed itineraries.
The pandemic fundamentally transformed the global travel and tourism industry in many ways, from the industry’s near-complete collapse with the shutdown of borders and international travel restrictions in the wake of COVID-19, to the unleashing of post-pandemic “revenge travel” as consumers sought to make up for lost time. Interestingly, however, while these shocks were temporary in nature and largely ran their course, slow travel is proving more durable, with consumers seeking more mindful, more meaningful, travel-for-longer experiences. An analysis of transactional-level VisaNet data from 203 countries and recognized territories reveals an increase in travel duration compared to the pre-pandemic period. In fact, travelers from a quarter of these countries stay at least one day longer on average than they did in 2019.
Travelers from around the world are traveling for longer
Travel’s gradual shift to longer trip durations
The convergence of several pandemic-induced trends has laid the foundation for the rise of slow travel, notably consumers’ lingering fatigue from stringent lockdowns and the proliferation of remote work arrangements. The pandemic’s strict lockdowns and restrictions likely caused consumers to pause and reflect on what they value the most. What emerged was a strong affinity and greater appreciation for experiences such as travel, going to concerts or dining out compared to material possessions. While “shiny objects” might be fun to have and may provide consumers with bragging rights, experiences represent a more lasting memory and often evoke intense emotions, especially if trying an activity for the first time.
The proliferation of flexible work arrangements also reinforced “slow travel” and paved the way for the emergence of combined business and leisure travel experiences, dubbed “bleisure” trips. Remote work and advancements in communication and technology have provided employees with the flexibility to work from anywhere, enabling them to extend business trips for leisure purposes or even plan their travels around their work schedules, culminating in a more blended travel experience. By April-May 2023, the global average for days worked from home per week for college graduates was around 1.1 days, with some advanced markets such as the U.S., U.K., Australia and Canada closer to 2 days.¹ Concurrently, the share of work-from-home job postings has increased significantly since 2020 and now accounts for more than 10 percent of total job postings in Spain, Canada and Austria.²
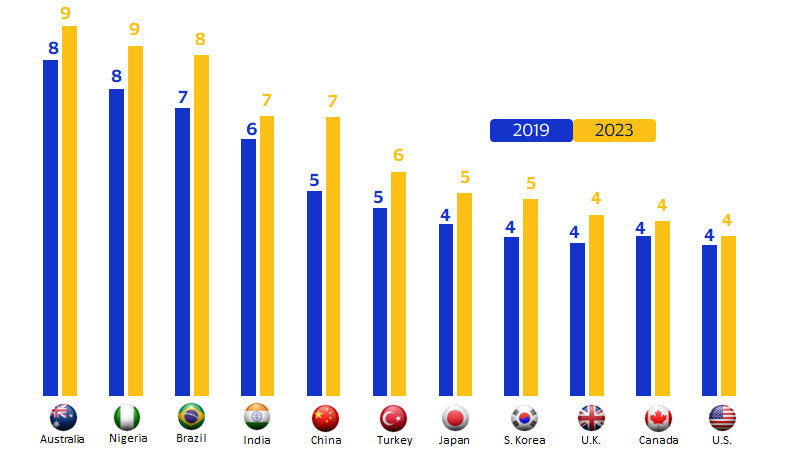
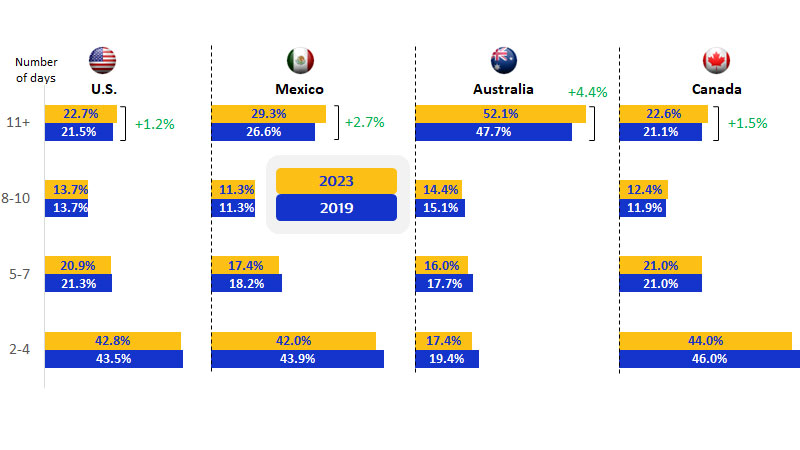
We've leveraged anonymized transaction-level data to estimate the typical duration of a cardholder's travel. We looked at the country of issuance of the bankcard, destination of travel, card-present transactions abroad and the duration of the card-present transactions abroad. This allowed us to track the evolution of the typical trip length since 2019. Out of 203 countries and recognized territories analyzed, travelers from 70 percent of these countries had a higher average length of travel in 2023 compared to 2019, with travelers from 1 in 4 countries having a higher average duration of travel by at least one day. The analysis of global travel distribution by duration reveals that 2-4 day trips accounted for the largest segment, representing 42 percent of total trips in both 2019 and 2023. However, there has been a notable shift towards longer trips, especially those over 11 days. This trend is prominent in major outbound travel markets, with longer trips increasing by 4.4 percentage points for Australians, 2.7 percentage points for Mexicans, 1.5 percentage points for Canadians, and 1.2 percentage points for Americans. Early signs of “revenge travel” in 2021 indicated a preference for longer trips (8-10 days or more). But as revenge travel ran its course, travel duration appears to have settled at a higher equilibrium in 2023, especially for trips longer than 11 days, surpassing 2019 figures.
Trip length is slowly settling at a higher duration compared to pre-pandemic
Digital nomadism reinforces slow travel
Many countries are capitalizing on the rise in digital nomadism and consumers’ growing tendency to travel for longer durations. Digital nomads are remote workers who live and work from different countries for extended periods, earning income from their home-based or remote companies while spending money locally. Estonia was one of the first to recognize this potential, officially unveiling “digital nomad” visas in August 2020. Since then, many countries have followed suit, and as of April 2024, an estimated 41 countries have established digital nomad visa programs or variations thereof.³ Countries around the world, including the U.A.E., Brazil, Portugal, Greece, Indonesia, Colombia, Spain, and Mexico, offer some form of digital nomad visa scheme. This policy shift has significantly boosted slow travel, with digital nomads opting for longer stays and fully immersing themselves in the local lifestyle—embracing the essence of slow travel.
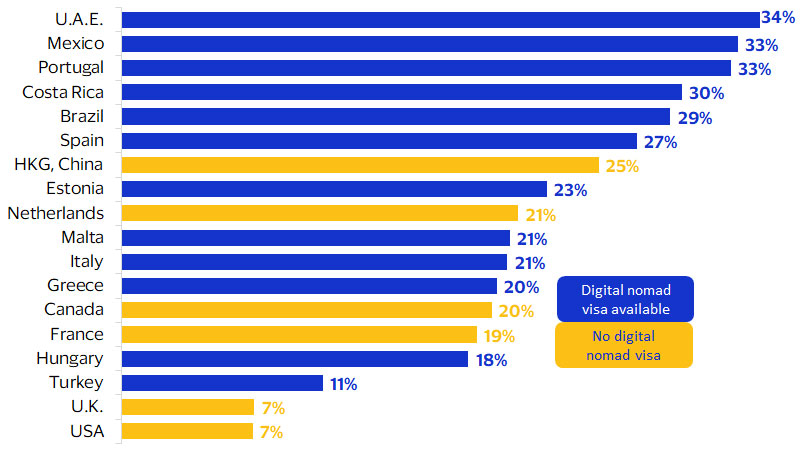
An analysis of average spending by tourists from around the world shows that countries offering digital nomad visas experienced the biggest change in average spending in 2023 compared to 2019. One important caveat, however, is that countries introduced digital nomad visa programs at various stages over the past four years. For example, Estonia was one of the earliest adopters in 2020, while Turkey was one of the later ones in early 2024. Therefore, the increase in spending might not be entirely explained by the availability of digital nomad visas alone. However, there is a general trend indicating that the availability of these visas has led to higher overall average spending by foreign tourists.
Our analysis reveals that the U.A.E., Mexico, and Portugal saw some of the most significant changes in overall spending (excluding lodging) by foreign tourists in 2023 compared to 2019, with increases of 34 percent, 33 percent, and 33 percent, respectively. As people travel for longer durations, they tend to spend more on leisure activities, restaurants, and transportation. This extended duration of stay translates into higher spending in the local economy, showcasing the economic benefits of catering to digital nomads and slow travelers.
Countries offering digital nomad visas generally saw greater increase in average spending by tourists
Weekend takeoffs: Fridays and Saturdays are the most popular first days of travel
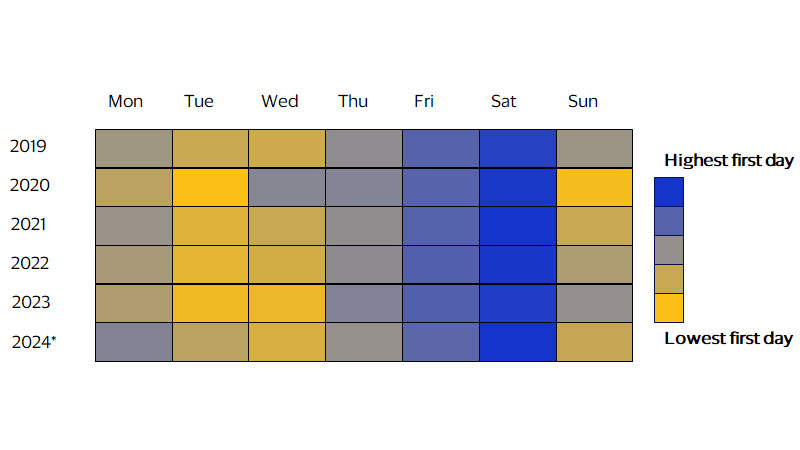
We also wanted to understand what day of the week was most popular for travelers embarking on their journey and whether that had changed since 2019. It appears Saturday was the most popular day, followed by Friday and to a lesser extent Thursday. Tuesday and Wednesday, on the other hand, appear to be the least popular first days for an overseas trip. This trend was quite consistent from 2019 up until June 2024, with the most popular first day of travel falling on the weekend or close to the weekend. A weekend first day of travel isn’t surprising, given that departing on a Friday or Saturday allows travelers to maximize their vacation time without taking too many days off from work. Starting the trip on a weekend also provides an opportunity to avoid weekday rush-hour traffic, making the travel experience smoother and less stressful. Arriving at the destination on a weekend also gives travelers a chance to take their time to settle in and adjust to the new environment. This strategic timing can enhance the overall travel experience, making weekends the preferred choice for beginning an international adventure.
This preference for weekend takeoffs is likely influenced by traditional Mon-Fri work schedules. However, with the growing trend of remote work and the flexibility it offers, particularly with many employees working from home on Fridays, Friday departures might become more popular in the future. Airlines could potentially capitalize on this by offering more award seats or cheaper fares on less popular travel days, smoothing out demand and optimizing load capacities.
Fridays and Saturdays are consistently the most popular first days of an overseas trip
Footnotes
- Zarate, P., Dolls, M., Davis, S. J., Bloom, N., Barrero, J. M., & Aksoy, C. G. (2024). Why does working from home vary across countries and people? (No. 32374). National Bureau of Economic Research.
- Zarate, P., Dolls, M., Davis, S. J., Bloom, N., Barrero, J. M., & Aksoy, C. G. (2024). Why does working from home vary across countries and people? (No. 32374). National Bureau of Economic Research.
- Immigrant Invest. (n.d.). 41 digital nomad visa countries: A complete list. Retrieved July 30, 2024
Forward-Looking Statements
This report may contain forward-looking statements within the meaning of the U.S. Private Securities Litigation Reform Art of 1995. These statements are generally identified by words such as “outlook”, “forecast”, “projected”, “could”, “expects”, “will” and other similar expressions. Examples of such forward-looking statements include, but are not limited to, statement we make about Visa’s business, economic outlooks, population expansion and analyses. All statements other than statements of historical fact could be forward-looking statements, which speak only as of the date they are made, are not guarantees of future performance and are subject to certain risks, uncertainties and other factors, many of which are beyond our control and are difficult to predict. We describe risks and uncertainties that could cause actual results to differ materially from those expressed in, or implied by, any of these forward-looking statements in our filings with the SEC. Expect as required by law, we do not intend to update or revise any forward-looking statements as a result of new information, future events or otherwise.
Disclaimer
The views, opinions, and/or estimates, as the case may be (“views”), expressed herein are those of the Visa Business and Economic Insights team and do not necessarily reflect those of Visa executive management or other Visa employees and affiliates. This presentation and content, including estimated economic forecasts, statistics, and indexes are intended for informational purposes only and should not be relied upon for operational, marketing, legal, technical, tax, financial or other advice and do not in any way reflect actual or forecasted Visa operational or financial performance. Visa neither makes any warranty or representation as to the completeness or accuracy of the views contained herein, nor assumes any liability or responsibility that may result from reliance on such views. These views are often based on current market conditions and are subject to change without notice.
Visa’s team of economists provide business and economic insights with up-to-date analysis on the latest trends in consumer spending and payments. Sign up today to receive their regular updates automatically via email.