Harnessing big data for natural disaster recovery and planning
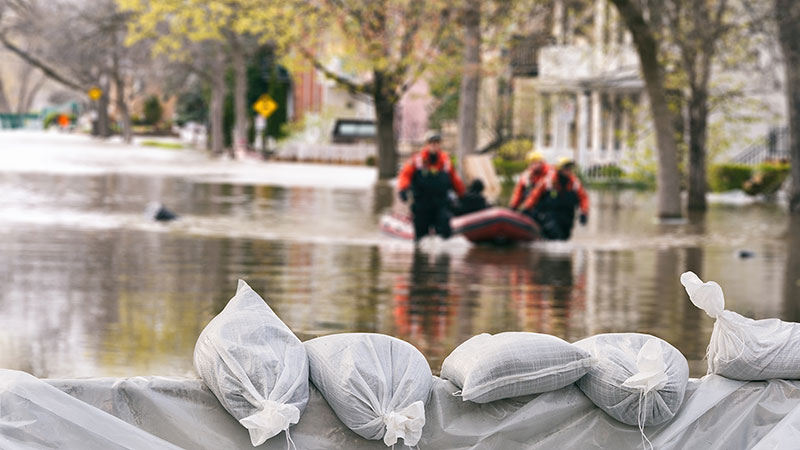
September 2025 – After a wildfire, flood, earthquake or other disaster strikes, the ruins left behind provide a visual reminder of a community’s physical losses. In contrast, visualizing the economic losses from natural disasters goes beyond what can be seen by the naked eye. Restoring a community’s built infrastructure is a necessary first step, but what about the social interactions, including commerce, that often define a community? This is where big data can help to recall what was lost, assess what remains and help in building back stronger and more resilient communities.
Cutting-edge geospatial analysis combined with anonymized VisaNet transactions can provide data and insights to assist in rebuilding economies following disasters. For this report, Visa Business and Economic Insights (VBEI) analyzed payments data for two recent disasters: Storm Boris in September 2024 in Central Europe and the Eaton and Palisades fires that swept through Los Angeles, Calif. in January of this year. Beyond looking at individual events, we also leveraged our proprietary Spending Momentum Index—combined with publicly available county-level data—to compare multiple natural disasters over time and better understand how big data can help unlock new ways to anticipate the potential challenges and needs of future crises. In the wake of natural disasters, big data can play a large role in helping communities and governments both measure the economic impact of an event and identify opportunities to better allocate resources to speed recovery in their rebuilding efforts.
Modeling spending and supply chains post-flooding
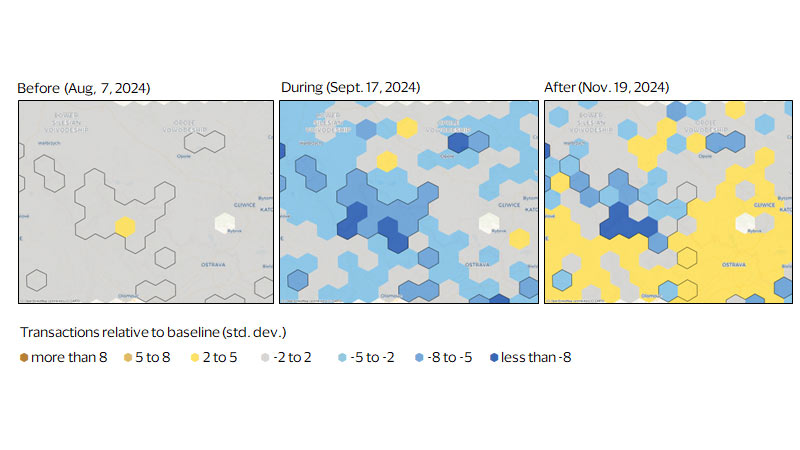
VBEI’s comparison of multiple disasters over time found significant variances in short term and longer-term impacts depending on the type of disaster, with floods taking a deeper toll on both consumer and merchant activity post-event. As part of this study, we analyzed aggregated transaction data for areas in Czechia and Poland that flooded during Storm Boris in September 2024. Using transaction counts, which better capture the impact of flooding on supply chains, we were able to visually reconstruct what the region’s economy looked like immediately prior, during and two months after the floods (see figure below).
The maps show that the floods impacted a wide swath of the region. In the areas with the worst flooding (outlined in black), consumer spending dropped by 47 percent relative to the projected baseline absent flooding. Two months after the floods had receded, much of the region’s economy was on the path to recovery, as denoted by the large areas shaded in yellow. The areas with more substantial damage, however, remained well below their baseline. Both the number of consumers and active merchants in these areas were still half of what they were prior to the floods.
Spending impact of the September 2024 floods in Central Europe
Applying big data to analyze the L.A. wildfires
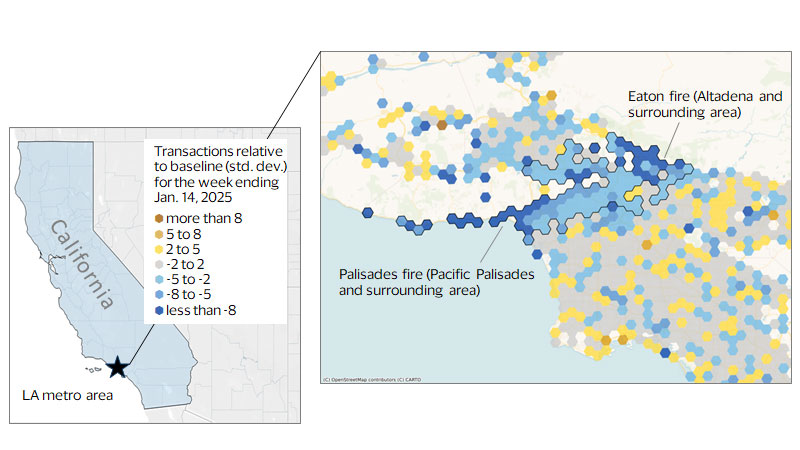
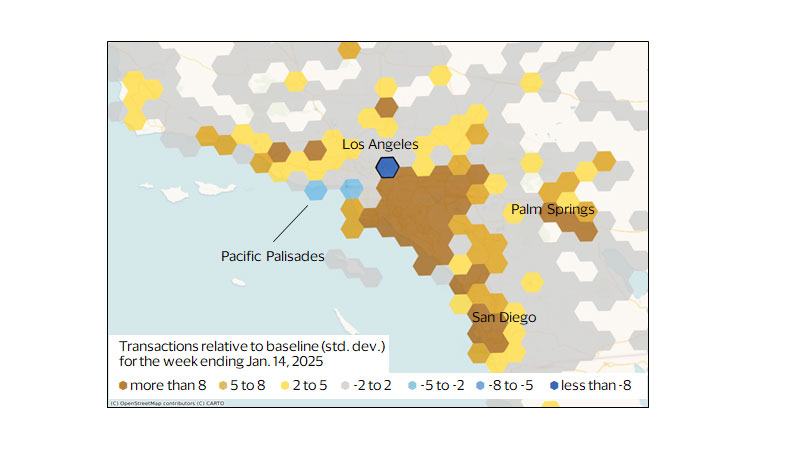
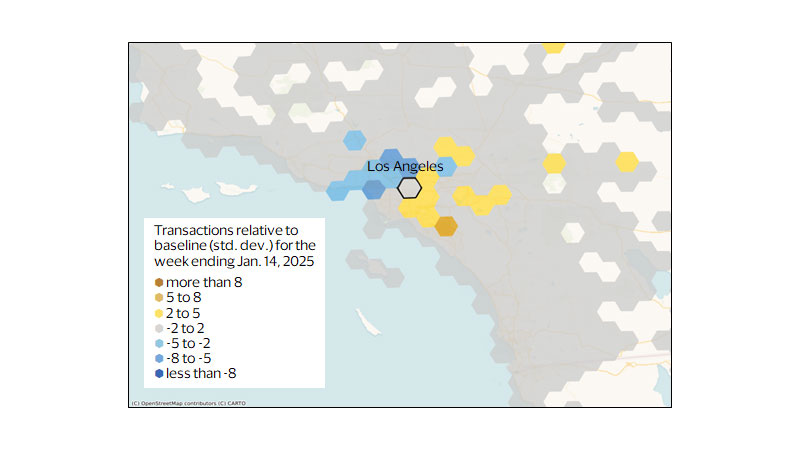
VBEI further explored how VisaNet transaction data could be useful at each stage of the recovery process for a more recent disaster: the Eaton and Palisades fires that swept through Los Angeles, Calif. in January of this year. The first step in the process of using data to help measure the impact of the damage and scope for recovery was to create a baseline of commerce in the area. Better than a snapshot, this baseline serves as an outline of spending that could have occurred in the region absent the wildfires.
To do this, we created a model based on VisaNet transaction data and a geospatial indexing system that divided Los Angeles into geographic cells. Each cell was assigned a predictive series to show what commerce would have looked like if the fire hadn’t happened (more details below). While the fires burned 37,830 acres¹— about the size of San Francisco—the initial economic impact from the wildfires was even more widespread. Our analysis indicates the wildfires lowered spending and disrupted commerce in communities spanning over 218,240 acres (view this map in the full PDF report).
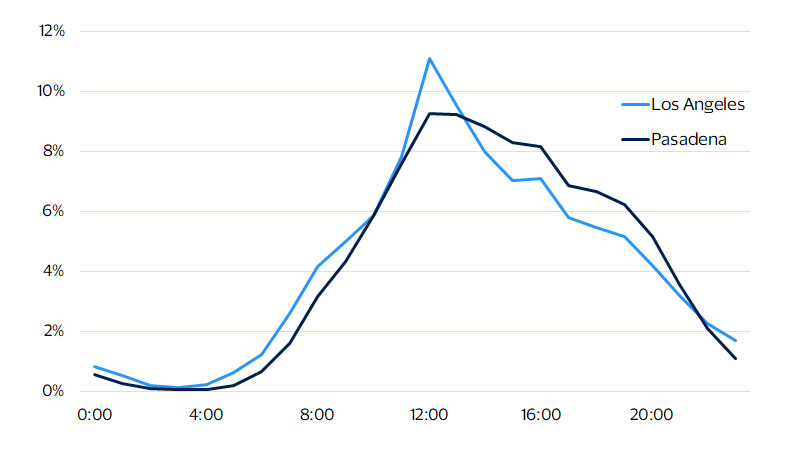
The data also helped to recall the flow of commerce within the impacted areas. Comparing the distribution of spending across a weekday² in downtown Pasadena as compared to downtown L.A. revealed important differences between the two areas. First, a greater share of transactions in downtown L.A. occurred in the morning and fewer in the evenings, suggesting that most sales took place during regular working hours. The reverse was true for Pasadena, indicating that most residents commuted out of the area for work. This inference is reinforced by the pronounced spike in spending around lunchtime in downtown L.A., which is not present in the impacted areas.
Purchases in downtown L.A. indicate more spend on morning coffees and lunchtime rush
Card transactions by hour (share of total per weekday)
Monitoring and measuring impact with data insights
Spending in areas impacted by the fires
Residents shifted their purchases over a wide area
Non-residents spent closer to home
Data for resilience and disaster planning
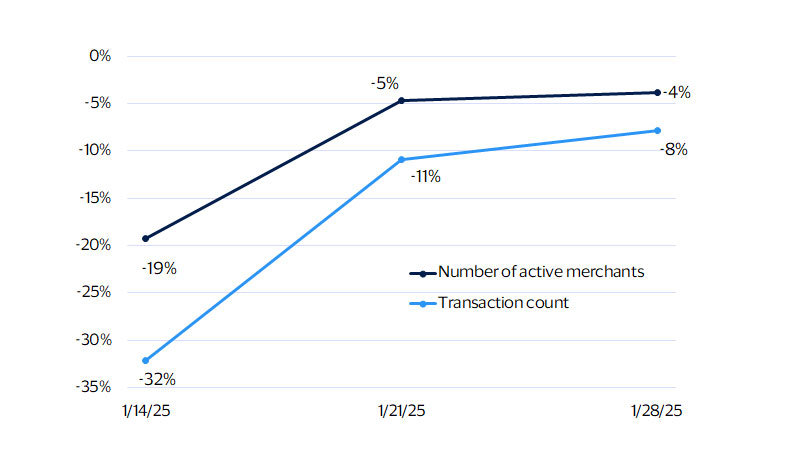
Commercial recovery takes hold after the L.A. fires
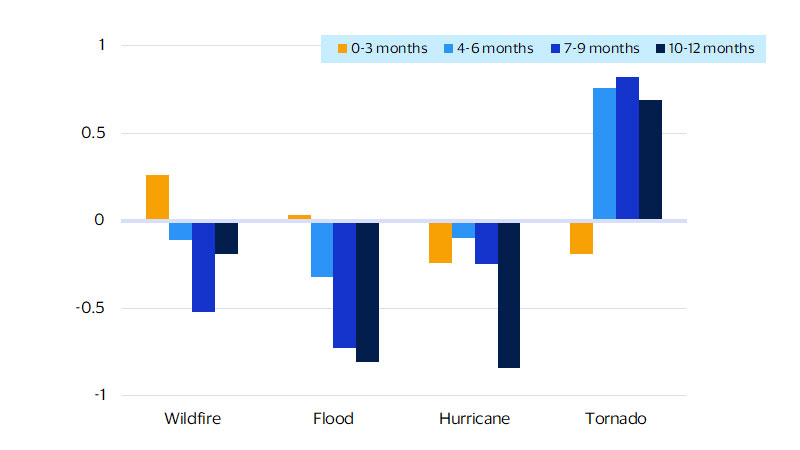
Beyond the value that big data brings to individual events, it can also unlock new ways to anticipate the potential challenges and needs of future crises by comparing multiple natural disasters over time. VBEI studied this by combining data from the Visa Spending Momentum Index (SMI), a consistent measure of consumer demand across U.S. counties, with data on disasters that led to at least $250 million in county-level losses from 2008–2023 as compiled by the Federal Reserve Bank of New York.³ The effect on spending is estimated by comparing the SMI in disaster-impacted counties relative to neighboring counties within the state during the same time period.
The data shows that natural disasters lead to a temporary boost in consumer activity that lasts 8–9 months after a major disaster, but with some payback thereafter as spending normalizes in the disaster’s aftermath (see figure below). Displaced residents must seek temporary housing, while those who remain increase their home improvement purchases to repair disaster-related damage, both of which lift discretionary spending. In contrast, normal everyday spending suffers, as those who are displaced tend to spend more on restaurants than groceries. Gasoline purchases are an additional early boost, with those fleeing the area fueling up their vehicles for longer drives.
Impact of natural disasters by type on consumer demand
Difference between impacted and other U.S. counties’ SMIs
Footnotes
- Doug C. Morton and Cindy Starr, “Spread of the Palisades and Eaton Fires – January 2025,” Friday July 11, 2025, NASA Scientific Visualization Studio.
- Weekdays for the purposes of this analysis are defined as starting at 5:00 p.m. on Sunday and running through 5:00 p.m. on Friday.
- Federal Reserve Bank of New York, Losses from Natural Disasters
- Local Business Directory – Find Local Businesses to Support | Visa
- Visa and Oxfam America to Explore Expanding Anticipatory Action Program to Bring Pre-Disaster Financial Support to the Philippines, Kenya, Colombia, and Puerto Rico | Visa
Forward-Looking Statements
This report may contain forward-looking statements within the meaning of the U.S. Private Securities Litigation Reform Act of 1995. These statements are generally identified by words such as “outlook”, “forecast”, “projected”, “could”, “expects”, “will” and other similar expressions. Examples of such forward-looking statements include, but are not limited to, statements we make about Visa’s business, economic outlooks, population expansion and analyses. All statements other than statements of historical fact could be forward-looking statements, which speak only as of the date they are made, are not guarantees of future performance and are subject to certain risks, uncertainties and other factors, many of which are beyond our control and are difficult to predict. We describe risks and uncertainties that could cause actual results to differ materially from those expressed in, or implied by, any of these forward-looking statements in our filings with the SEC. Except as required by law, we do not intend to update or revise any forward-looking statements as a result of new information, future events or otherwise.
Disclaimers
The views, opinions, and/or estimates, as the case may be (“views”), expressed herein are those of the Visa Business and Economic Insights team and do not necessarily reflect those of Visa executive management or other Visa employees and affiliates. This presentation and content, including estimated economic forecasts, statistics, and indexes are intended for informational purposes only and should not be relied upon for operational, marketing, legal, technical, tax, financial or other advice and do not in any way reflect actual or forecasted Visa operational or financial performance. Visa neither makes any warranty or representation as to the completeness or accuracy of the views contained herein, nor assumes any liability or responsibility that may result from reliance on such views. These views are often based on current market conditions and are subject to change without notice.
Visa’s team of economists provide business and economic insights with up-to-date analysis on the latest trends in consumer spending and payments. Sign up today to receive their regular updates automatically via email.