Economic outlook and forecasts Home for the holidays: spending stays closer to home

November 2026 – Cooling job growth, rising inflation, and extreme uncertainty—the list of economic pressures this holiday season feels the same as last year’s. We think the result will also look the same: consumer spending will remain resilient. But what does consumer resilience actually mean? When we talk about consumer resilience, we are not describing households gritting their teeth and spending through adversity. We are describing consumers who still have financial capacity to spend. That spending capacity largely comes from after-tax (disposable) income growth. While fewer jobs are being created in this low-hire, low-fire labor market, income growth continues to hold up. As a result, real disposable income growth should remain supportive of consumer spending heading into the holiday. While renewed inflation pressures will erode some purchasing power, those pressures are concentrated in specific categories, creating a more nuanced picture for holiday spending.
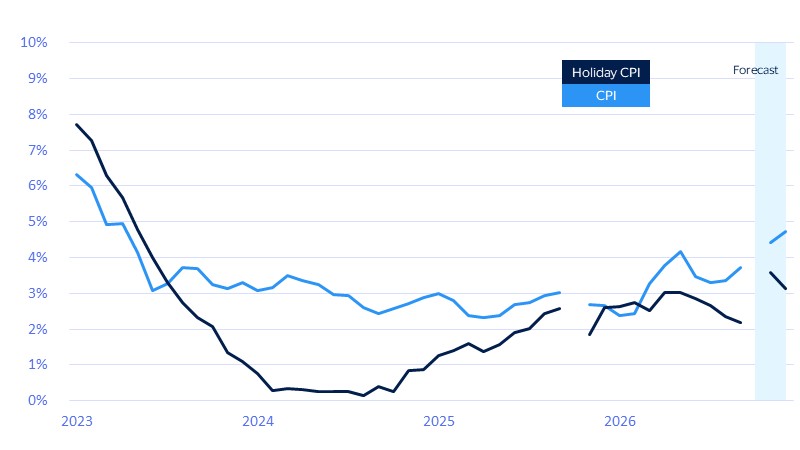
This distinction is captured in our Holiday CPI, a tailored index designed to reflect the typical holiday shopping basket. While higher energy prices are pushing up travel and transportation costs and lifting September headline CPI to 3.7 percent, holiday sales inflation remains softer at 2.2 percent. That difference reflects milder price growth in food at home and recreational goods, which account for roughly three-quarters of the Holiday CPI basket. As a result, inflation pressures are rising the hardest outside the core holiday spending categories, which should support spending on holiday related items this season.
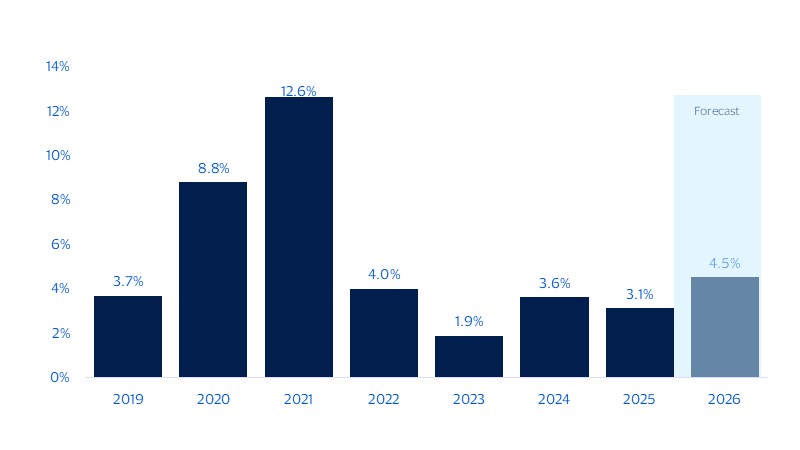
Strong market gains will also provide consumers with more confidence and capacity to spend, although this will be felt most among affluent households. Taken together, these factors are expected to support holiday sales growth of 4.5 percent YoY this season, or 4.6 percent if the month of October is included. But while holiday-specific inflation is running below headline CPI, it remains elevated, meaning much of that growth will still reflect higher prices rather than stronger underlying demand, with inflation risks tilted higher.
Holiday sales inflation is set to lag headline CPI
Headline CPI vs. holiday sales (SA, YoY percent change)
Travel is on the wish list, but physical gifts made the budget
Inflation is not only reshaping how far holiday dollars will stretch but also where those dollars are likely to be spent.
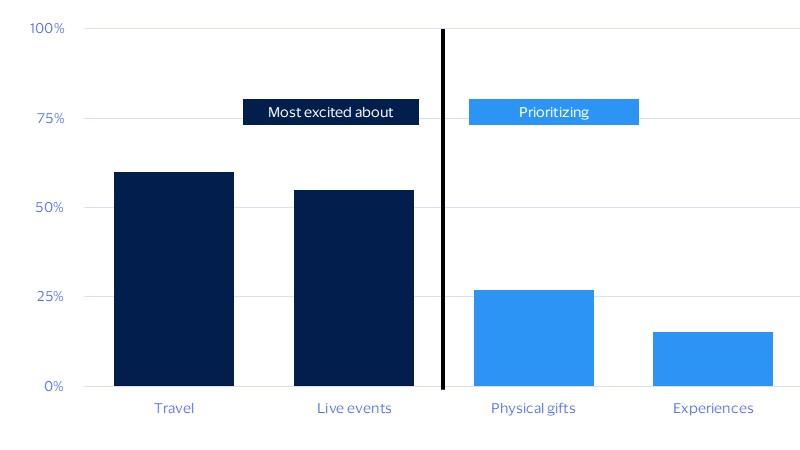
Our definition of holiday sales excludes travel, but when we asked consumers what they were most excited about gifting or receiving this year, travel and other experiences were the clear winner. More than half of respondents put travel and live events at the top of their wish lists. This is not surprising; consumers have consistently prioritized spending on experiences to create memories and emotional connection. But higher travel costs this holiday season may temporarily buck that longer-term shift, pushing spending back toward traditional physical holiday gifts. We asked those same consumers where their money is going to be prioritized, and just 15 percent said they’re prioritizing experiences compared to 27 percent on physical gifts (see figure below).
Travel and other experiences top holiday wish lists, but physical gifts are taking priority
Most desired gifts vs. holiday spending priorities (Percent, share responding)
The gap between aspiration and allocation isn’t spread evenly. Using anonymized Visa credit card transactions, we looked at September airfare bookings and spending by income for trips departing between November 1 and January 15 of next year. Only households with an income above $200,000 expanded travel on both fronts, booking 29 percent more trips and spending 38 percent more compared to the same month last year. Nearly every other income group pulled back sharply, suggesting that high costs are increasingly limiting holiday travel to only affluent households.
The holiday travel split tracks the inflation outlook, with price pressures running hotter in travel, transportation and other sectors directly exposed to energy costs than in physical goods. This leaves lower- and middle-income households with less room to maneuver. Our October consumer survey shows that roughly one-third of consumers with an income below $100,000 plan to switch to lower cost brands or stores for holiday gifts this season compared to last year.¹ Trading down is easier on a sweater, but far more difficult on a plane ticket. The prioritization of physical gifts is a bullish signal for holiday sales. With fewer consumers planning to travel this holiday season, more spending may be directed toward gift-related purchases in stores and online.
Keeping the registers ringing this holiday season: sales expected to accelerate
Our forecast of 4.5 percent YoY holiday sales growth would mark the strongest holiday sales reading since 2021. However, much of that growth is expected to reflect higher prices rather than an increase in purchasing activity. Inflation this year will have two key effects on holiday spending. First, the higher cost of holiday travel may shift some demand from travel-related spending to physical gifts. Additionally, higher inflation will inflate holiday spending. We expect consumer prices for holiday related goods will climb 3.4 percent this season, YoY. There is also one more shopping day this season compared to last year, which will provide a slight tailwind for sales. But there may be fewer shoppers dashing through the stores for retailers. After accounting for inflation on holiday items, real spending—a good proxy for foot traffic—is expected to rise just 1.1 percent this year, down from the 1.3 percent that occurred last season.
Holiday sales
NSA, retail sales less autos, gas and restaurant sales in November and December
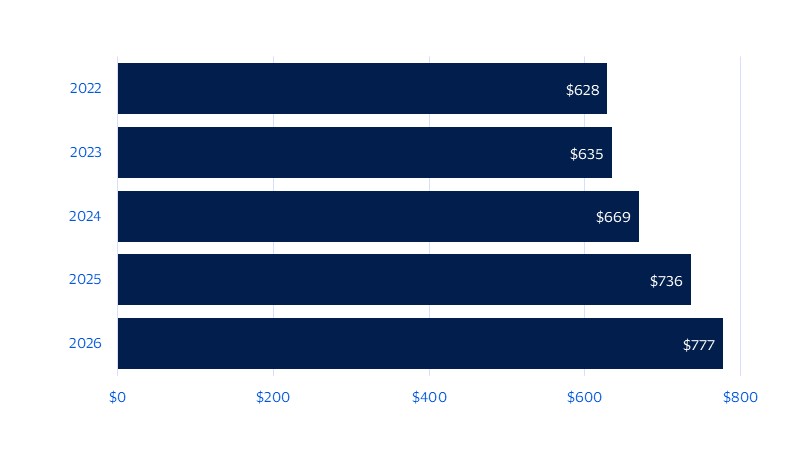
Average amount consumers plan to spend on gifts this holiday season
(Dollars)
Making a list and checking it twice: risks to the outlook
While holiday spending is expected to post another solid year, the outlook has become increasingly uncertain. From tariffs to elevated energy inflation, consumer spending has remained resilient. While current trends point to another healthy holiday season, several factors could easily change the trajectory.
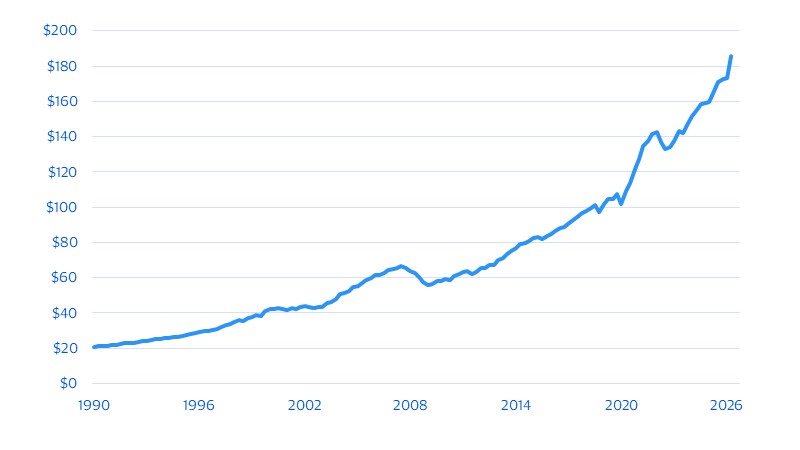
Household wealth continues to play an important role in supporting consumer spending. Household net worth has reached historic highs over the last few quarters (see figure below). This has supported consumer spending—particularly among affluent households—through the wealth effect, whereby households tend to spend more as the value of their assets rises. If the current bull market continues to broaden, it could provide an additional boost to holiday sales. Further upside to the outlook could emerge if there is a meaningful decline in energy prices, which would provide relief to real (inflation-adjusted) incomes. Given the volatility in energy prices over recent months, there is a chance that energy inflation could retreat as we head into the holiday season. Lower inflation would help ease pressure on household finances and support discretionary spending heading into the holidays. Holiday spending could exceed expectations if equity gains continue, and real (inflation-adjusted) income growth accelerates.
Household wealth remains near record highs
Household net worth (NSA, trillions)
However, some factors could lead consumers to become more cautious. For example, while the wealth effect can boost holiday spending, it can also become a source of risk to the outlook. As consumer spending has become increasingly supported by gains in household wealth, a meaningful stock market correction could weaken the wealth effect and temper spending. In addition, if inflation accelerates beyond our current forecast, higher prices could begin to weigh more heavily on household budgets. Approximately 84 percent of consumers report taking steps to manage higher everyday costs over the past year, with many seeking discounts and even cutting back on discretionary purchases.⁴ This suggests consumers remain highly price sensitive and increasingly selective in how they allocate their spending. While consumers have adapted to higher prices by adjusting their spending patterns, a reacceleration in inflation and weaker financial markets could reinforce value-seeking behavior and increase caution around purchases this holiday season. As a result, sales growth may further mask the disconnect with underlying demand.
The outlook for this holiday season remains strong, with 4.5 percent YoY growth representing a healthy pace of spending. However, elevated uncertainty leaves a wide range of potential outcomes. Lower inflation and rising household wealth could support stronger than expected holiday spending, while a resurgence in inflation and a pullback in financial markets could leave consumers more cautious, resulting in fewer gifts under the tree as households become more selective in how they allocate their budgets.
Footnotes
- Visa Business and Economic Insights Quarterly Consumer Survey, October 2026
- Visa Business and Economic Insights and U.S. Department of Commerce
- Visa Business and Economic Insights Quarterly Consumer Survey, October 2026
- Visa Business and Economics Insights and Visa Spending Shift 2026
Forward-Looking Statements
This report may contain forward-looking statements within the meaning of the U.S. Private Securities Litigation Reform Act of 1995. These statements are generally identified by words such as “outlook”, “forecast”, “projected”, “could”, “expects”, “will” and other similar expressions. Examples of such forward-looking statements include, but are not limited to, statements we make about Visa’s business, economic outlooks, population expansion and analyses. All statements other than statements of historical fact could be forward-looking statements, which speak only as of the date they are made, are not guarantees of future performance and are subject to certain risks, uncertainties and other factors, many of which are beyond our control and are difficult to predict. We describe risks and uncertainties that could cause actual results to differ materially from those expressed in, or implied by, any of these forward-looking statements in our filings with the SEC. Except as required by law, we do not intend to update or revise any forward-looking statements as a result of new information, future events or otherwise.
Disclaimers
The views, opinions, and/or estimates, as the case may be (“views”), expressed herein are those of the Visa Business and Economic Insights team and do not necessarily reflect those of Visa executive management or other Visa employees and affiliates. This presentation and content, including estimated economic forecasts, statistics, and indexes are intended for informational purposes only and should not be relied upon for operational, marketing, legal, technical, tax, financial or other advice and do not in any way reflect actual or forecasted Visa operational or financial performance. Visa neither makes any warranty or representation as to the completeness or accuracy of the views contained herein, nor assumes any liability or responsibility that may result from reliance on such views. These views are often based on current market conditions and are subject to change without notice.
Visa’s team of economists provide business and economic insights with up-to-date analysis on the latest trends in consumer spending and payments. Sign up today to receive their regular updates automatically via email.