Billions of wallets: India and Mainland China transform regional travel spend

September 2024 – In the decade before the pandemic, international travel in Asia Pacific was transformed by the emergence of a large number of outbound travellers from Mainland China, many of whom ventured across borders for the first time. The Mainland Chinese tourist was a huge source of growth for both destinations and brands, and much effort went into understanding and meeting this group’s needs.
After the pandemic, the nature of Mainland Chinese travellers—and the wider travel landscape in Asia Pacific—has changed markedly. Fewer Mainland Chinese travellers are now spending more, and on different types of goods. Meanwhile, a new force on the horizon, Indian tourists, appears set to radically change tourism spending in the coming decade. Navigating the changing nature of big spenders from Mainland China, alongside being ready to capture the rapidly growing Indian outbound market, will be the keys to capturing tourism spend in Asia Pacific in the years ahead.
Before the pandemic, Mainland China was by far the most important outbound travel market in Asia Pacific, accounting for around 34 percent of the region’s cross-border spend in Q1-2019, according to the Visa International Travel (VISIT) platform.¹ But the travel industry’s hopes for a rapid recovery after its borders re-opened in early 2023 have been dashed: At the end of Q2-2024, outbound visitor numbers from Mainland China were only at around 70 percent of their 2019 levels. Tourists from Mainland China were already contending with difficulties getting visas and reduced flight capacity.² Now, lower expectations of household income growth are weighing further on their desire to travel abroad.³
Key drivers of tourism growth
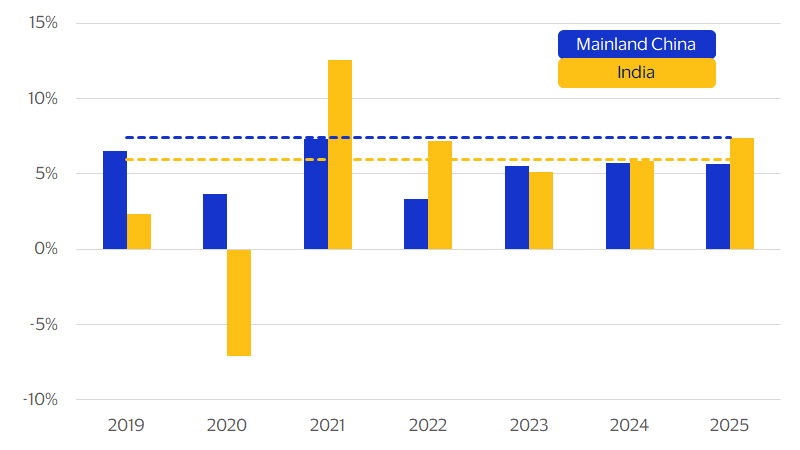
Total real household disposable income growth in Mainland China has been below its pre-pandemic average rate and is expected to stay weak amid worries over a property-market slump and a broader economic slowdown. By contrast, India has seen a spectacular post-pandemic rebound in household income growth, which is expected to remain elevated in the coming years. Together with the fact that the number of Indian tourists travelling abroad surpassed its pre-pandemic level in 2023, this trend suggests that the amount of spend by Indian travellers, while small today, is likely to be the most transformative force in Asia Pacific travel over the next decade.
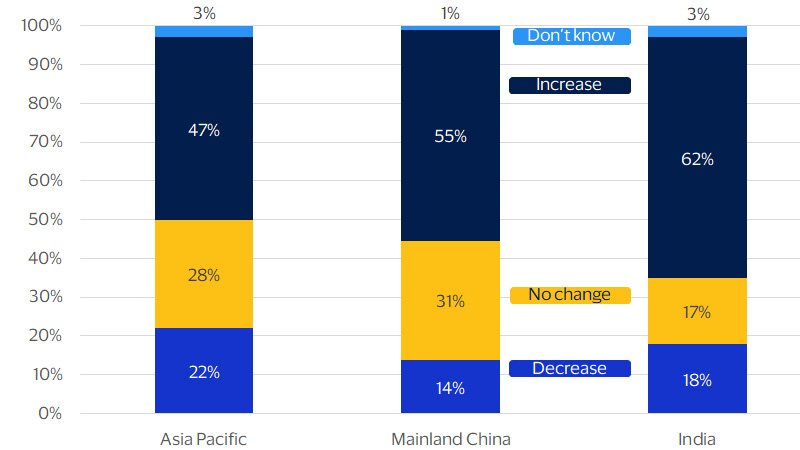
As a highly discretionary category of spend, and with an obvious substitute in the form of domestic tourism, international traveller numbers and spend are sensitive to consumer sentiment. According to Visa’s survey,⁴ the share of consumers in India who plan to increase their spend on discretionary goods and services is 62 percent—the second highest share of any market in Asia Pacific. Furthermore, among the Asia Pacific countries surveyed, Indian consumers were one of the highest shares of consumers reporting a desire to spend on luxury goods.
While a similar share of consumers in both countries intends to spend on travel, our research indicates that:
- Consumers in Mainland China are gravitating towards domestic travel. By contrast, those in India have shown interest in both domestic and international travel; and
- Tourists from Mainland China are rotating spend away from luxury goods and more towards experiences such as accommodation and restaurants, whereas tourists from India have been splurging on luxury goods.
Household income growth in India is expected to increase
Consumers in India are optimistic about their discretionary spending
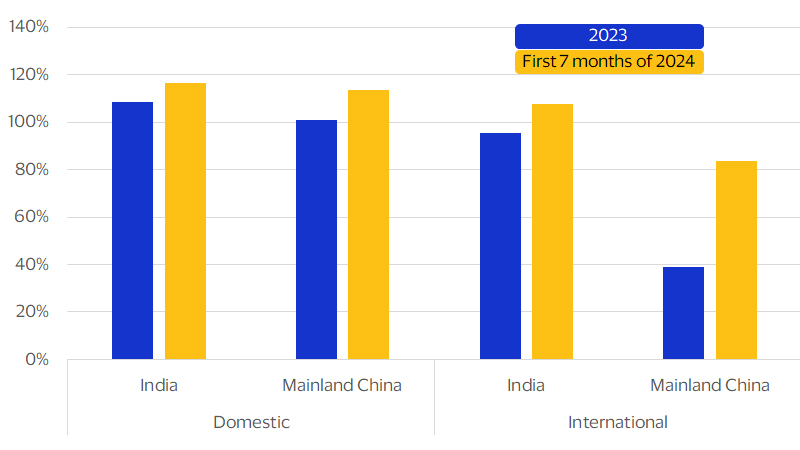
International air travel soared for India, but remains grounded for Mainland China
Despite being a smaller market compared to Mainland China and accounting for less than 20 percent of Mainland China’s total cross-border spend, India’s tourism market is growing at a faster rate. International air travel from Mainland China only recovered 84 percent of its 2019 levels in the first seven months of 2024, while equivalent volumes from India were well over 100 percent in the same period. Mainland China’s weak international travel performance can partly be attributed to difficulties in getting visas and permission to travel, lack of flight capacity, and financial constraints. On the other hand, international air travel took off for India, due in part to migration to the Middle East, and visits to friends and family rising as more Indians emigrate.5
According to Visa’s International Travel Platform, Mainland Chinese outbound tourism accounted for around 30 percent of outbound visitors from Asia Pacific in 2019, as compared to only 6 percent for India. Since the pandemic, the origin of travellers in the region has shifted markedly, with those from Mainland China now only accounting for around 22 percent of travellers in 2023 and those from India rising to 7 percent. Tourists from Mainland China are spending big abroad: Despite their smaller numbers, the amount spent overall led to a 77 percent recovery of its 2019 levels.
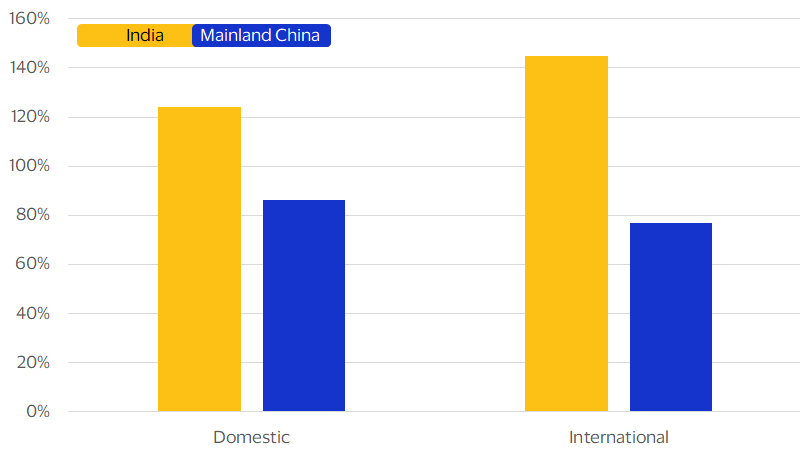
Domestic tourism achieved a full recovery in 2023 in terms of air passenger traffic for both Mainland China and India (Fig. 3). However, the recovery for India has been even stronger. According to OAG, India has moved up the ranks from fifth to third largest domestic aviation market in 10 years, with a domestic airline capacity of 15.6 million seats in April 2024.⁶ This represents an annual growth of 6.9 percent, beating Mainland China’s growth by 0.6 percentage points. One tailwind is the availability of low-cost carriers in India, which enables more price-sensitive Indian tourists to travel by air. These carriers make up over 75 percent of India’s total domestic air capacity—compared to around 13 percent in Mainland China. With the influx of domestic tourists coupled with healthy household income growth, domestic tourism spend in India saw a strong uplift, growing by 24 percent of its 2019 levels in 2023 By contrast, domestic tourism spend in Mainland China has yet to recover, partly because consumers have been cautious spenders while on holiday.
Travellers from Mainland China gravitate toward domestic destinations
Recovery in total spend by domestic tourists in Mainland China has been on par with international tourists
Reaching new peaks in cross-border spend on luxury goods
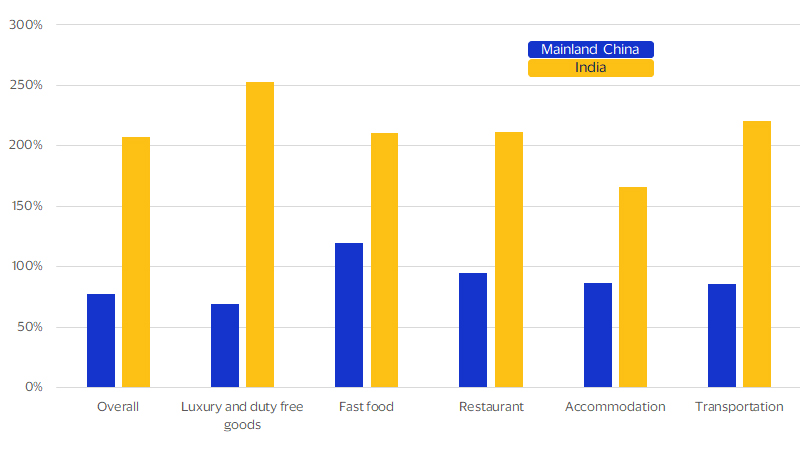
Indian travellers might not spend much on luxury goods today, but they are showing signs of being a big growth market in the coming decade. To further analyse cross-border in-person spend behaviour, we examined Visa-branded consumer cards issued in Mainland China and India. Our analysis revealed that, while overall transaction counts on consumer cards reached full recovery in Q1-2024, total cross-border transaction value in Mainland China recovered by only 78 percent of its Q1-2019 level. In India, total cross-border spending not only recovered, but more than doubled, at 207 percent of its Q1-2019 level.
Experiences such as dining out, rather than big-ticket items such as luxury goods, are driving spending growth for Mainland Chinese travelling internationally. By contrast, India’s outbound spend on luxury and duty-free goods in Q1-2024 was 2.5 times its Q1-2019 levels, outpacing overall India cross-border spend. Indians are spending more, and a larger share of that spending is on luxury goods. Those in Asia Pacific’s travel industry face a very different environment than they did before the pandemic, and these trends are likely to prove lasting. International travellers from Mainland China are coming in smaller numbers, spending more at the aggregate level, and gravitating towards experiences and daily activities. In contrast, the number of Indians travelling abroad is growing fast, and these tourists show an increasing appetite for high-end goods.
Tourists from Mainland China have been cautious in their cross-border card spend, whereas tourists from India are more willing to splurge abroad
Footnotes
- The Visa International Travel (VISIT) platform is a proprietary model that combines Visa's cardholder data with publicly available cross-border arrival statistics. Visa uses this data to econometrically model official arrival statistics compiled by various government sources and to generate estimates that fill in the large gaps existing in the cross-border travel data.
- Visa Business and Economic Insights. (2023). Strong midyear global travel likely but destination mix may be changing. Retrieved from https://usa.visa.com/dam/VCOM/regional/na/us/partner-with-us/economic-insights/documents/vbei-global-travel-insight-may-2023.pdf
- Visa Business and Economic Insights. (2024). 2023 was the year of beach and business destinations, Visa estimates show. Retrieved from https://usa.visa.com/dam/VCOM/regional/na/us/partner-with-us/economic-insights/documents/vbei-global-travel-insight-mar-2024.pdf
- Visa Green Shoots Radar Survey (Wave 13). January 2024.
- OAG. (2024). India’s domestic aviation: a deep-dive into a decade of growth. Retrieved from https://www.oag.com/blog/indias-domestic-aviation-market
- OAG. (2024). India aviation: international intentions and hub expansion. Retrieved from https://www.oag.com/blog/indian-aviation-international-intentions
Forward-Looking Statements
This report may contain forward-looking statements within the meaning of the U.S. Private Securities Litigation Reform Art of 1995. These statements are generally identified by words such as “outlook”, “forecast”, “projected”, “could”, “expects”, “will” and other similar expressions. Examples of such forward-looking statements include, but are not limited to, statement we make about Visa’s business, economic outlooks, population expansion and analyses. All statements other than statements of historical fact could be forward-looking statements, which speak only as of the date they are made, are not guarantees of future performance and are subject to certain risks, uncertainties and other factors, many of which are beyond our control and are difficult to predict. We describe risks and uncertainties that could cause actual results to differ materially from those expressed in, or implied by, any of these forward-looking statements in our filings with the SEC. Expect as required by law, we do not intend to update or revise any forward-looking statements as a result of new information, future events or otherwise
Disclaimer
The views, opinions, and/or estimates, as the case may be (“views”), expressed herein are those of the Visa Business and Economic Insights team and do not necessarily reflect those of Visa executive management or other Visa employees and affiliates. This presentation and content, including estimated economic forecasts, statistics, and indexes are intended for informational purposes only and should not be relied upon for operational, marketing, legal, technical, tax, financial or other advice and do not in any way reflect actual or forecasted Visa operational or financial performance. Visa neither makes any warranty or representation as to the completeness or accuracy of the views contained herein, nor assumes any liability or responsibility that may result from reliance on such views. These views are often based on current market conditions and are subject to change without notice.
Visa’s team of economists provide business and economic insights with up-to-date analysis on the latest trends in consumer spending and payments. Sign up today to receive their regular updates automatically via email.