It’s beginning to look a lot like…a normal holiday season

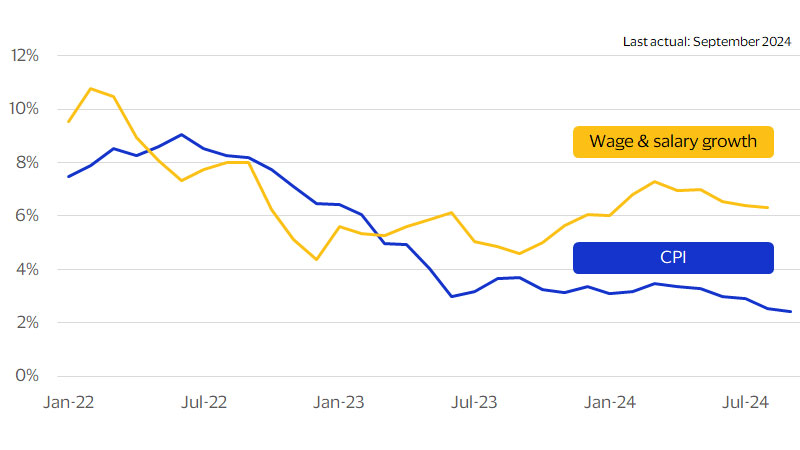
October 2024 – With the holiday shopping season just around the corner, we’ve noticed several encouraging trends on the consumer side of the economy. For starters, job growth continues to hold up despite still-elevated interest rates. Perhaps more importantly, wage growth continues to outstrip inflation, lifting the real (inflation-adjusted) purchasing power of consumers. Both the incoming retail sales data through September and our latest Spending Momentum Index (SMI) readings continue to underscore the resilience of consumer spending—albeit at a more modest pace.¹ The news is not all positive, however, as confidence measures continue to reflect consumers’ ongoing concerns about future economic growth.² These concerns, combined with seasonal and demographic factors, shape our view of holiday spending this year.
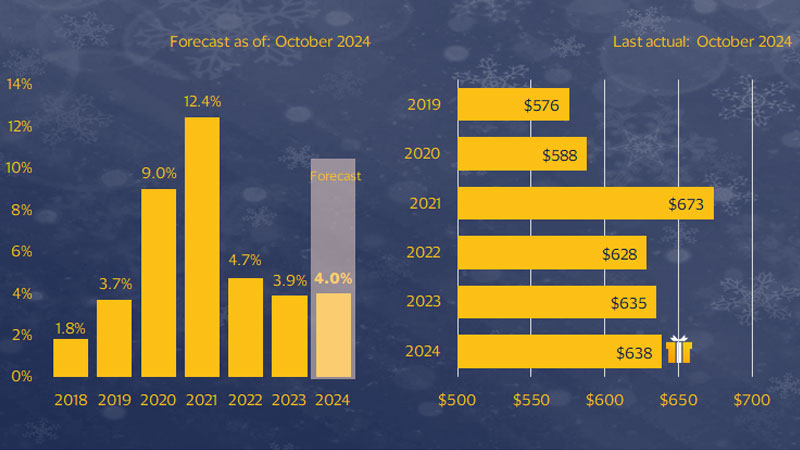
When assessing holiday sales each season, we pay particular attention to real disposable income growth. This real income growth was revised higher, suggesting that consumers are on a more solid footing than first thought.³ With new retail sales and income data in-hand, we have upwardly revised our holiday spending forecast this season from our earlier estimate. We now see holiday sales* rising 4.0 percent YoY this season, or 3.9 percent if the month of October is included. Our forecast is roughly on par with last holiday season’s sales growth, but if realized would still be slightly above the average 3.6 percent growth we saw during the last expansion (2010-2019).
Wage and salary growth vs. inflation as measured by the Consumer Price Index (CPI)
(SA, YoY percent change)
‘Tis the season for changing holiday spending patterns
There’s a surge in spending every December as consumers flock to stores—and increasingly to the internet—to purchase gifts and celebrate the holidays with friends and family. To account for this holiday spending surge, the U.S. Census applies a seasonal adjustment to retail sales data based on what the agency expects the sales bump to be each year. One trend this seasonal adjustment process reveals is that the December sales surge has dwindled to a fraction of its former size.
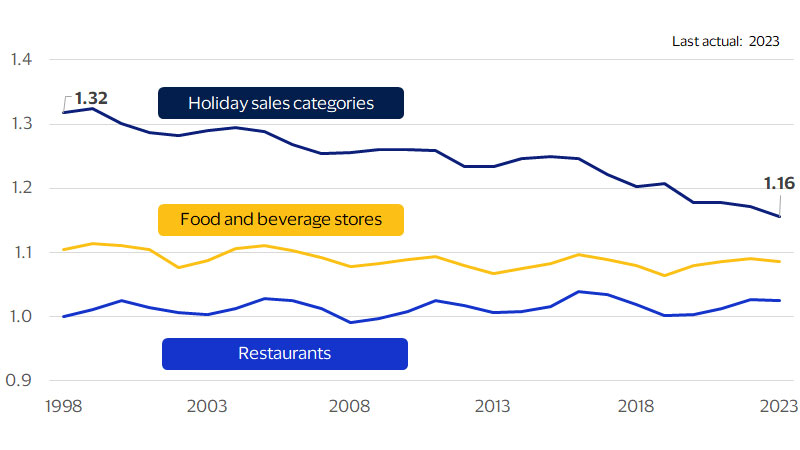
In 1998, the December adjustment factor was 1.32, which means the Census expected the holidays to contribute 32 percent to growth that month—growth below that would register as a decline in the seasonally adjusted data. In 2023 it was 1.16—half of what it was in 1998. The sharp downward trend of these seasonal adjustments implies that the surge in consumer spending that takes place every December has diminished over the years. However, it has not declined evenly across spending categories.
Grocery stores and restaurants are still garnering the same December sales bump they have for decades—consumers still enjoy dining out and preparing holiday meals. Why is the spending bump at grocery stores and restaurants holding steady while the holiday sales bump declines?
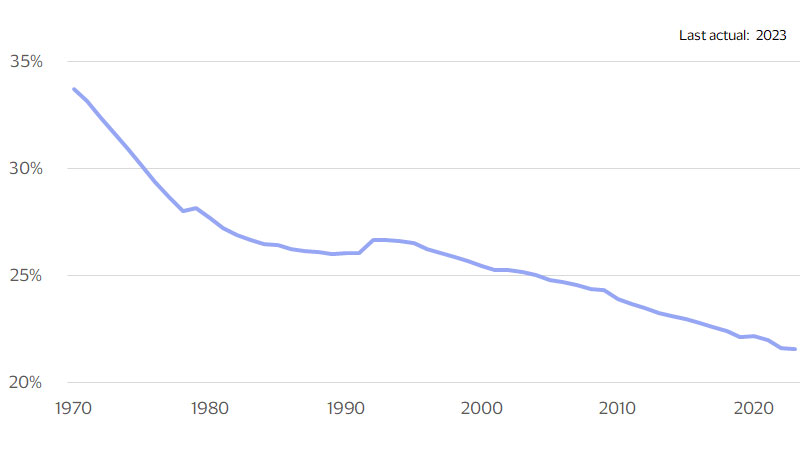
There are a myriad of reasons, but part of the answer lies in our definition of holiday sales and underlying demographics. Our retail sales categories can be viewed as a proxy for presents, since they exclude sales from automotive dealers, gas stations and restaurants. If consumers are buying fewer presents it could be because there are fewer kids for Santa to visit. Children made up more than one-third of the U.S. population in 1970 but accounted for just over one-fifth in 2023. Similarly, the number of American families with children peaked in 2007 at 37 million but has since fallen to 33 million as of 2023.
The December holiday sales bump isn’t what it used to be
U.S. Census retail sales adjustment for December (nominal)
Santa’s target audience has shrunk
Share of U.S. population under 18 years old (percent)
Early indicators suggest consumers are mixed about spending this holiday season
The combination of moderating consumer spending growth, a prolonged shopping season and demographic headwinds points toward a 4.0 percent YoY increase in holiday sales this season, roughly similar to last year's. Given the ongoing trend for a more elongated holiday shopping season, we have also estimated holiday sales including the month of October. Under this broader definition, we expect holiday sales to rise 3.9 percent YoY, down from 3.8 percent in 2023.
Further reinforcing our forecast for this year are our latest quarterly consumer survey results. Although consumers indicate that they will spend more this holiday season compared to 2023, there are some nuances that paint a more fragile picture. The differences primarily exist in the perceptions between expected overall dollar spend—often quite difficult for consumers to truly estimate—and the general feeling surrounding those total outlays, which can lead them to spend more or less than in the previous year.
Holiday retail spending (NSA*, adjusted retail sales excluding autos, gas and restaurants) (YoY percent change) and Average amount consumers plan to spend on gifts this holiday season (Dollars)
Who will drive holiday spending this year?
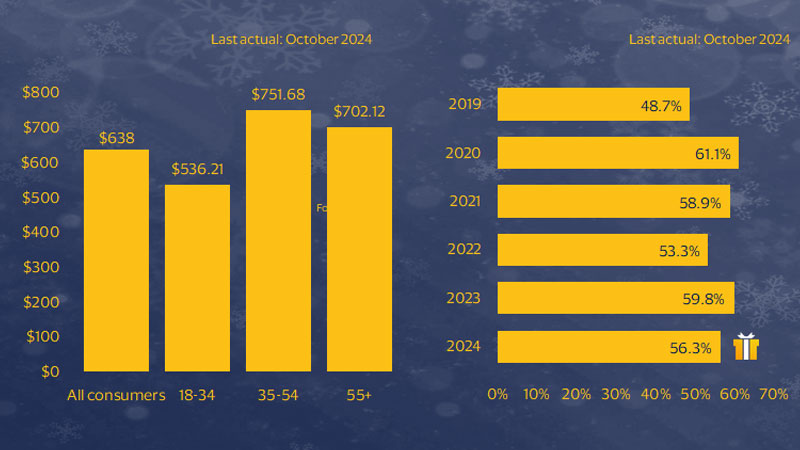
The fragility exists among those planning to spend more, specifically middle-aged and older consumers. Roughly 15 percent of 35 to 54-year-olds plan to spend more, down from nearly 22 percent in 2023. Their intended overall spend, however, tops the list at over $750 on average across the age group, up from $690 in 2023. These mixed messages paint a solid picture in October that could falter in November and December. Consumers over 55 also expect to increase spending, with an average outlay of over $700 compared to $613 in 2023. Consistent with 2023, 5.8 percent expect to spend more this year, while a slightly fewer 21.4 percent expect to spend less.
Consumers gave several reasons for spending less, with “not as much extra income this year” a leading reason, cited by 56.4 percent of consumers who said they will spend less. This skews higher for older consumers (62.5 percent among those 55 and above). Interestingly, “higher gas prices”—a primary reason cited for spending less in 2023—declined in importance among consumers, with 24.5 percent citing it as a reason compared to over 34 percent in 2023. Roughly one-third of consumers continued to cite a lower level of confidence in the economy as a reason for spending less, equal to their 2023 selections. As with 2023, this skews older, with 42.1 percent of consumers 55+ who said they will spend less this year citing lack of confidence in the economy as a driver for lower holiday spending.
Among those planning to increase spending, “more people to buy for this year,” and “a special gift that is more expensive” top the list for most demographic groups, and skew younger, with a higher number of 18- to 34-year-olds citing these reasons. Twenty-seven percent of consumers who expected to spend more also said they planned ahead for the holidays and “intentionally saved more money to spend this year,” up from 23 percent in the 2023 survey. Nearly half of consumers indicated that most or all of their holiday shopping will be via mobile device, similar to 2023. And more than half say that they will be shopping online for most of their holiday purchases, emphasizing the importance of goods purchases as well as the need for retailers to fully ensure the robust nature of both their online and mobile offerings.
Average amount consumers plan to spend on gifts by age and Share of consumers planning to do most or all of their holiday shopping online
Footnotes
- Visa Business and Economic Insights and U.S. Department of Commerce. The Visa U.S. SMI measures the current month relative to the same month last year. Both national and regional readings of the index are based on year-over-year changes in consumer spending with Visa bankcards.
- Visa Business and Economic Insights and Conference Board
- Visa Business and Economic Insights and U.S. Department of Commerce
- Visa Business and Economic Insights and Economic Insights Quarterly Consumer Survey, October 2024. Average gift spending by income group from the October Economic Insights Quarterly Consumer Survey was weighted by the share of the consumer base by income level from the U.S. Department of Labor’s 2023 Consumer Expenditure Survey to get the average gift spending for all income groups.
Forward-Looking Statements
This report may contain forward-looking statements within the meaning of the U.S. Private Securities Litigation Reform Art of 1995. These statements are generally identified by words such as “outlook”, “forecast”, “projected”, “could”, “expects”, “will” and other similar expressions. Examples of such forward-looking statements include, but are not limited to, statement we make about Visa’s business, economic outlooks, population expansion and analyses. All statements other than statements of historical fact could be forward-looking statements, which speak only as of the date they are made, are not guarantees of future performance and are subject to certain risks, uncertainties and other factors, many of which are beyond our control and are difficult to predict. We describe risks and uncertainties that could cause actual results to differ materially from those expressed in, or implied by, any of these forward-looking statements in our filings with the SEC. Expect as required by law, we do not intend to update or revise any forward-looking statements as a result of new information, future events or otherwise.
Disclaimer
The views, opinions, and/or estimates, as the case may be (“views”), expressed herein are those of the Visa Business and Economic Insights team and do not necessarily reflect those of Visa executive management or other Visa employees and affiliates. This presentation and content, including estimated economic forecasts, statistics, and indexes are intended for informational purposes only and should not be relied upon for operational, marketing, legal, technical, tax, financial or other advice and do not in any way reflect actual or forecasted Visa operational or financial performance. Visa neither makes any warranty or representation as to the completeness or accuracy of the views contained herein, nor assumes any liability or responsibility that may result from reliance on such views. These views are often based on current market conditions and are subject to change without notice.
Visa’s team of economists provide business and economic insights with up-to-date analysis on the latest trends in consumer spending and payments. Sign up today to receive their regular updates automatically via email.