New corridors and hotspots take flight in AP’s evolving travel scene

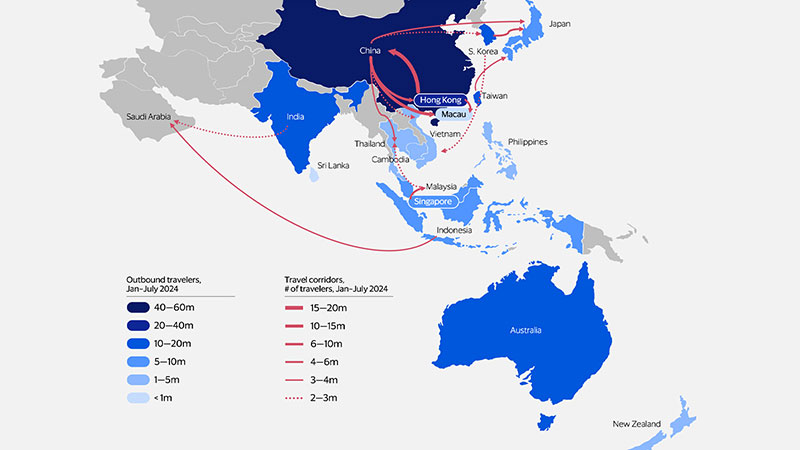
Top 15 largest cross-border travel corridors in Asia Pacific
Where do you go?
Markets around Asia Pacific’s busiest border crossings typically involve some combination of geographic closeness, economic integration, or cheap shopping on one side of the border.
Despite the major slowdown in outbound travel from Mainland China, the immense scale of that market manifests: Outbound travel from Mainland China to Macau, Hong Kong, Thailand and Japan represents four of the 10 largest corridors in Asia Pacific, while a further two of the top 10 are travellers from Hong Kong going to Mainland China or Macau. Travel between the three parts of the dynamic Greater Bay Area accounts for a full 25 percent of total trips within the Asia Pacific region. The rest of the top 10 corridors can be attributed to South Koreans and Taiwanese visiting their neighbors in Japan, Singapore residents hopping over the border to Malaysia, and Indonesians travelling to Saudi Arabia, primarily for the Hajj pilgrimage. Cheap shopping is a major pull factor for half of the top 10 routes (Singapore to Malaysia, Hong Kong to Mainland China, and the three inbound Japan routes).
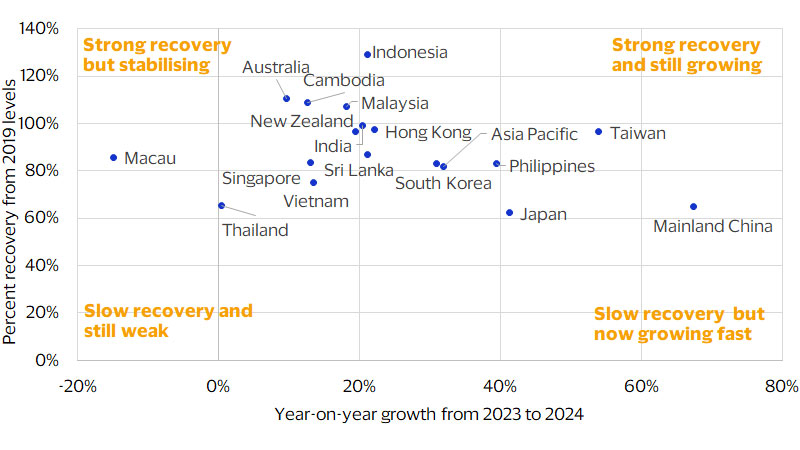
Indonesia leads travel recovery in the region, while Japan and Mainland China lag behind
Mainland Chinese dreams of travel
In early 2023, Mainland China re-opened its borders—the last major jurisdiction in the region to do so. The return of travellers from Asia Pacific’s largest outbound tourism market was hotly anticipated by the travel industry, but the boom times of the previous decade have not returned.
Slowing income growth and falling property prices have reduced household travel budgets, along with discretionary spend overall, and higher inflation in destinations than at home has cut affordability. Regulations are not helping, either. It has become more difficult for many to get the required permits to go abroad, and governments have yet to rescind certain regulations introduced during the pandemic. Flight capacity is down, with airlines such as British Airways, American Airlines and Qantas cancelling some Mainland China routes. This is partly about a lack of demand, but also due to regulatory asymmetries around the use of Russian airspace.
The shifts in Mainland China’s outbound travel have hit Taiwan’s tourism industry particularly hard, with the number of visitors from January to July 2024 still 40 percent lower than the equivalent period in 2019. Hong Kong has also had low overall visitor numbers for the same reason. While growth in outbound trips from Mainland China in the last year is, at 67 percent, the highest in Asia Pacific, this is mainly due to the low point of comparison in 2023. Tourism-dependent merchants in many destinations have adapted to the absence of Mainland Chinese travellers, but the ongoing large gap between the number of trips in 2019 compared to more recent figures should leave enough room to deliver ongoing growth of around 20 percent in the year ahead. Destinations with weaker currencies and lower inflation, like Japan and South Korea, and places offering visa-free access, like Thailand and Singapore, are likely to be larger beneficiaries as Mainland Chinese visitors edge back towards 2019 levels near the end of 2025 or early 2026.
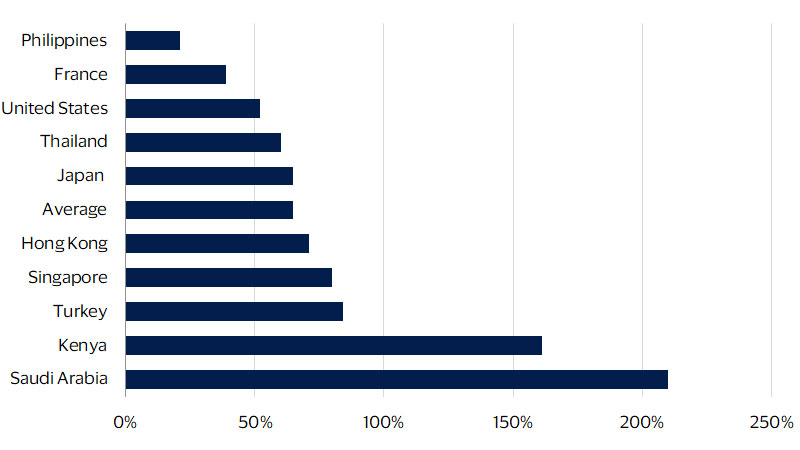
Mainland China’s outbound travellers are shifting from Europe and the U.S. to the Middle East and Africa
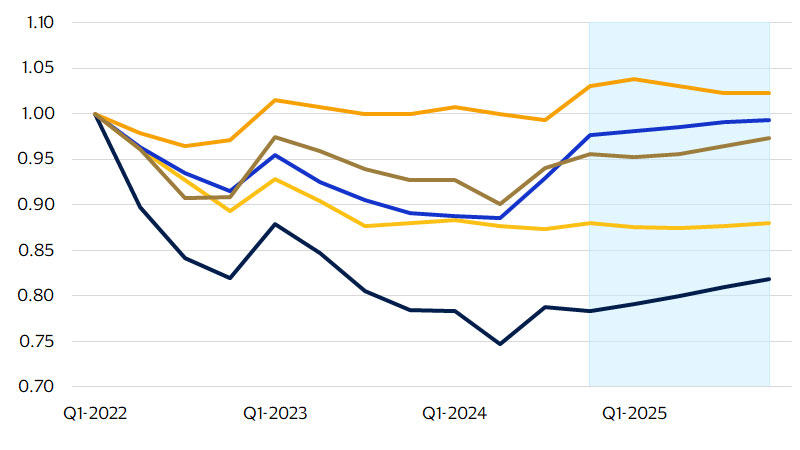
Some things are getting cheaper these days
Asian currency valuations diverged markedly during the last interest rate cycle
New adventurers
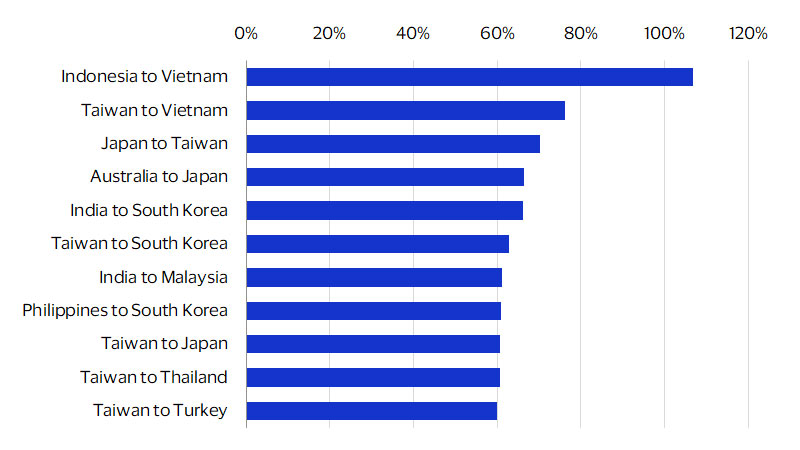
If you catch a low-cost flight in India or Indonesia, you have a good chance of sitting near someone who is flying for the first time. Rising incomes and household wealth in fast-growing economies like India, Indonesia and the Philippines are creating new middle classes and increasing the number of outbound travellers. With visitor numbers approaching 30 percent above pre-pandemic levels, Indonesia has seen the strongest outbound recovery in the region, and travel from Indonesia to Vietnam is quickly emerging as a hotspot leisure corridor, while outbound travel from Taiwan has been similarly robust. The most populous economy in Asia Pacific—India—is undoubtedly on the radar of anyone involved in Asia Pacific’s travel industry. Inbound visits are up 18 percent since 2019, the second-highest growth rate in the region (after New Zealand), to reach 9.3 million in the year to July 2024. Outbound visits, at 13.2 million, are back to their 2019 levels after rising by 20 percent in the last year. India is now the fourth-largest origin market in Asia Pacific after Mainland China, Hong Kong and South Korea. Excluding intra-China travel, it would be larger than Hong Kong and nearly two-thirds as big as Mainland China.
The boom in Indian tourism, while also driven by the rising incomes of the middle class and expansion in airport capacity seen in Mainland China in previous decades, has its own characteristics. Family visits with a growing diaspora are a more significant driver of outbound travel, with four of the top five destinations having large diaspora populations (Saudi Arabia, the U.S., the U.A.E. and Singapore). Indians now make up the largest cohort of Asia Pacific visitors to the U.S., with tech and finance employment hubs like New York and San Francisco being major destinations. In these cases, those working abroad might be paying for the trip. Southeast Asia is more favored as a leisure destination by Indian travellers: Visits to Thailand are up 33 percent so far in 2024 (making it the region’s third-most popular destination) and those to Malaysia up 61 percent, while Indians are now the second-largest single nationality amongst visitors to Bali, having doubled their share of arrivals since 2019.
The last four years brought marked shifts in travel corridors in Asia Pacific, with substantial changes in market share of both origins and destinations. With Mainland China in a new phase of economic development, plus shoppers hunting for bargains abroad and new, middle-class tourists with distinct travel motivations, now is an opportune time to assess product offerings.
Selected fast-growing travel corridors from Asia Pacific
Forward-Looking Statements
This report may contain forward-looking statements within the meaning of the U.S. Private Securities Litigation Reform Art of 1995. These statements are generally identified by words such as “outlook”, “forecast”, “projected”, “could”, “expects”, “will” and other similar expressions. Examples of such forward-looking statements include, but are not limited to, statement we make about Visa’s business, economic outlooks, population expansion and analyses. All statements other than statements of historical fact could be forward-looking statements, which speak only as of the date they are made, are not guarantees of future performance and are subject to certain risks, uncertainties and other factors, many of which are beyond our control and are difficult to predict. We describe risks and uncertainties that could cause actual results to differ materially from those expressed in, or implied by, any of these forward-looking statements in our filings with the SEC. Expect as required by law, we do not intend to update or revise any forward-looking statements as a result of new information, future events or otherwise
Disclaimer
The views, opinions, and/or estimates, as the case may be (“views”), expressed herein are those of the Visa Business and Economic Insights team and do not necessarily reflect those of Visa executive management or other Visa employees and affiliates. This presentation and content, including estimated economic forecasts, statistics, and indexes are intended for informational purposes only and should not be relied upon for operational, marketing, legal, technical, tax, financial or other advice and do not in any way reflect actual or forecasted Visa operational or financial performance. Visa neither makes any warranty or representation as to the completeness or accuracy of the views contained herein, nor assumes any liability or responsibility that may result from reliance on such views. These views are often based on current market conditions and are subject to change without notice.
Visa’s team of economists provide business and economic insights with up-to-date analysis on the latest trends in consumer spending and payments. Sign up today to receive their regular updates automatically via email.