It’s retirement time in America

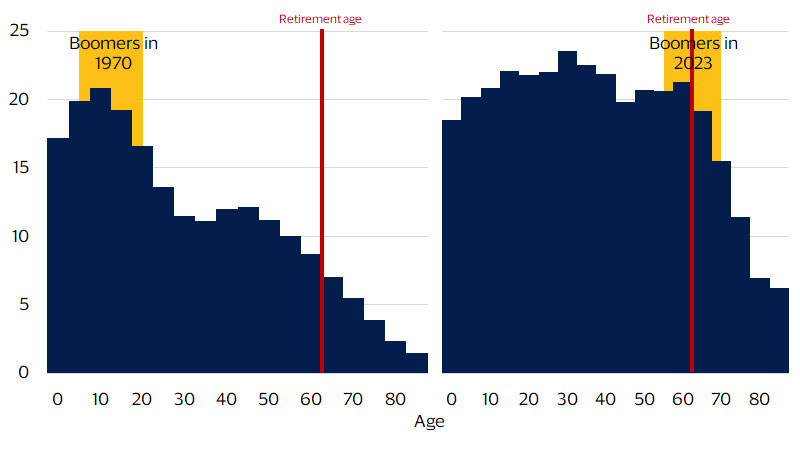
November 2024 – Baby boomers—born between 1946 and 1964—have always had an outsized presence compared with other generations. Four times larger than any previous birth wave,¹ their sheer size created a massive bulge in an otherwise narrow age distribution that ensured every stage of their life was experienced by the entire country, too. Starting in the 1970s, the entrance of boomers to the workforce, particularly women, kicked off a surge in labor force participation that continued over the next three decades. As they age through their 60s, 70s, 80s and beyond, the big bulge of the baby boomer generation is now a retirement wave (see figure below). More than 11,000 Americans will turn 65 every day—or more than 4.1 million every year—from 2024 to 2027.²
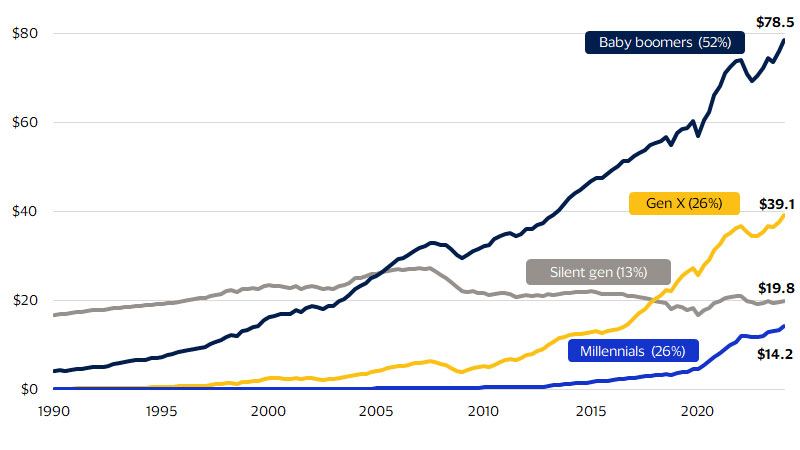
Boomers appear well-positioned to spend big in retirement, with $78.5 trillion in wealth,³ supplemented by social security. Our analysis indicates that they are apt to spend their wealth, too. For every $1 increase in financial wealth, Americans 65 and older spend an additional 11 cents. With social security tied to the rate of inflation, this wealth is a potential source of real spending growth; however, there are gaping wealth disparities across the baby boomer cohort. Affluent boomers with an average net worth over $4.4 million have more flexibility to spend, but most have a net worth below $185,000.⁴ With about two decades of life expectancy left at age 65, this wealth must last.⁵ Given these constraints, we expect baby boomer spending to grow slower than overall consumer spending over the next decade, with Gen X now the dominant consumer generation and millennials approaching their peak spending years.
The baby boom has become the retirement wave
Population distribution of the U.S. in 1970 vs. 2023 by age (in millions)

Sources of income in retirement
The shifting of income sources in retirement will have a dramatic effect on the spending potential of baby boomers. About 90 percent of Americans between the ages of 25 and 54 receive wage income.⁶ This figure drops to 73 percent for people between the ages of 55 and 64, and plummets to 23 percent for seniors 65 and over.* The loss of wages is a major financial change for retirees because they become dependent on social security, retirement account distributions and other financial assets for monthly income. Social security is the dominant source of income for seniors,* but payment increases are tied to inflation. Consequently, there is no potential for real income growth with social security and seniors’ ability to spend is constrained.
That leaves financial assets as potential sources of spending growth. Baby boomers are sitting on more than half of all household wealth (see figure below), making them the wealthiest generation in American history. Most of this wealth (55 percent) is in the form of investments, cash and other financial assets.⁷ Housing equity comprises the remaining 45 percent, with most baby boomers either owning their home outright or holding a low, fixed-rate mortgage. Additionally, housing wealth has skyrocketed in recent years due to the run-up in prices fueled by housing shortages in many communities across the U.S.
Baby boomers hold more than 50 percent of total household wealth
Wealth by generation US$ trillions (percent of total wealth)

How does baby boomer wealth influence spending?
Older Americans exhibit a greater financial wealth effect
Change in spending per $1 change in wealth
These results are intuitive. Younger consumers leave their financial investments untouched to allow for compounding growth, but they may feel more comfortable tapping home equity or increasing spending because of home equity. For seniors on fixed incomes, a paid-off home may be more valuable as a rent-free place to live rather than housing equity that can be tapped. While seniors are more apt to spend more when their wealth increases, only a fraction of wealth growth converts to spending, and this relationship is fragile. Even when weighted toward high-grade bonds and other safe assets, a 401(k) can be up one month and down the next, and this volatility makes the senior wealth effect somewhat fleeting. Strong market performance may occasionally encourage seniors to take larger withdrawals from their retirement accounts to fund discretionary spending; however, this pattern can reverse when the market is down.
Seniors must also balance their account withdrawals with how long they expect to live. The remaining life expectancy at age 65 is 17 years for men and 20 years for women, which means financial assets need to go the distance.⁹ They may also want to leave behind a legacy and pass down wealth to their family. To meet their financial goals and avoid outliving their savings, retirees often follow a sustainable drawdown of their portfolio that withdraws interest while mostly preserving the principle. The need to preserve financial wealth for the long run is a significant constraint to spending growth in retirement.
What about affluent baby boomers?
While baby boomers are the richest generation in history, that wealth is not evenly distributed across the population. Using data from the Federal Reserve in combination with Visa data, we estimated the net worth range for the top 20 percent of baby boomers (i.e., the affluent) down to the bottom 20 percent.* We found significant disparities across wealth groups, with 10 percent of baby boomers—or 7 million—classifying as affluent with an average net worth greater than $4.4 million. In contrast, about 60 percent of boomers—or 41 million—have a net worth below $185,000. These findings put the $78.5 trillion stockpile of baby boomer wealth into context. Affluent baby boomers, especially those at the higher end of the top 20 percent range, can spend their wealth more freely; however, most boomers have a modest nest egg by comparison and must adhere to a sustainable withdrawal rate to avoid outliving their savings.
With significant wealth, affluent boomers have been consistently spending more than other consumers.* This spending growth gap peaked in 2023 as stocks soared (the affluent have more exposure to equity markets), and as revenge travel and other post-pandemic consumer trends played out. Additionally, the average consumer has a higher debt profile, including a mortgage, student loans and/or a car loan. In contrast, boomers typically have fewer debt obligations that constrain spending. Even with wealth and debt advantages, growth has slowed significantly in 2024. We expect spending growth from affluent boomers to continue tracking faster than that of average consumers, but financial constraints will still require many to cut back their spending in retirement. This is particularly true for those near the bottom of the top 20 percent range. While they still have a lot of wealth, they will need to carefully balance their spending with their retirement goals to make it last.
Passing the spending baton
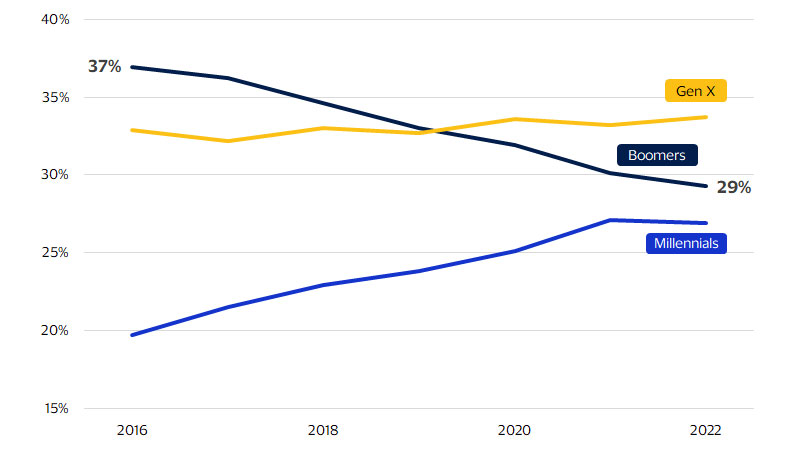
As more baby boomers retire in the coming years, their spending will decrease. This shift is consistent with a natural arc in spending that occurs over one’s lifetime,* which shows that consumers follow a predictable spending pattern as they age. This arc explains the variance in spending by generations. Gen X and millennials have entered or are entering their peak spending years, while baby boomers are phasing out of theirs. When we look at spending by generation (see figure below), baby boomers have moved beyond their peak spending years, falling from 37 percent of consumer spending in 2016 to 29 percent in 2022.¹⁰ Gen X are now the dominant consumers, accounting for 34 percent of spending. Millennials are right behind baby boomers at 27 percent. As baby boomers age, they have less of an impact on discretionary spending. They move along the spending arc to nursing home care and prescription drugs, which become more prominent in their budget over time. This shift toward health care expenses, along with the loss of wage income and the need to sustainably withdraw from their nest egg, put downward pressure on spending growth.
We expect baby boomer spending to grow at an annualized rate of 1.7 percent over the next decade,* trailing the 4.2 percent pace anticipated for all consumers during the same period.¹¹ While baby boomers hold significant wealth, only a fraction of it converts to additional spending due to the income and spending constraints of retirement. After years of being dubbed the “forgotten generation,” Gen X are now the dominant consumers and punching above their weight in consumer spending. With millennials also set to enter their peak spending years in the next decade, evolving consumption patterns will create opportunities to acquire new customers and establish loyalty.
Boomers’ share of spending has steadily declined since 2016—Gen X is now the dominant spending generation
Consumer spending by generation (percent share)

Footnotes
- U.S. Department of Commerce
- The Alliance for Lifetime Income
- Federal Reserve Board
- Visa Business and Economic Insights, VisaNet, TransUnion and Federal Reserve Board
- Social Security Administration
- U.S. Department of Commerce
- Federal Reserve Board
- Visa Business and Economic Insights, VisaNet, TransUnion and Federal Reserve Board
- Social Security Administration
- U.S. Department of Labor
- U.S. Department of Labor and Congressional Budget Office
Forward-Looking Statements
This report may contain forward-looking statements within the meaning of the U.S. Private Securities Litigation Reform Act of 1995. These statements are generally identified by words such as “outlook”, “forecast”, “projected”, “could”, “expects”, “will” and other similar expressions. Examples of such forward-looking statements include, but are not limited to, statements we make about Visa’s business, economic outlooks, population expansion and analyses. All statements other than statements of historical fact could be forward-looking statements, which speak only as of the date they are made, are not guarantees of future performance and are subject to certain risks, uncertainties and other factors, many of which are beyond our control and are difficult to predict. We describe risks and uncertainties that could cause actual results to differ materially from those expressed in, or implied by, any of these forward-looking statements in our filings with the SEC. Except as required by law, we do not intend to update or revise any forward-looking statements as a result of new information, future events or otherwise.
Disclaimers
The views, opinions, and/or estimates, as the case may be (“views”), expressed herein are those of the Visa Business and Economic Insights team and do not necessarily reflect those of Visa executive management or other Visa employees and affiliates. This presentation and content, including estimated economic forecasts, statistics, and indexes are intended for informational purposes only and should not be relied upon for operational, marketing, legal, technical, tax, financial or other advice and do not in any way reflect actual or forecasted Visa operational or financial performance. Visa neither makes any warranty or representation as to the completeness or accuracy of the views contained herein, nor assumes any liability or responsibility that may result from reliance on such views. These views are often based on current market conditions and are subject to change without notice.
Visa’s team of economists provide business and economic insights with up-to-date analysis on the latest trends in consumer spending and payments. Sign up today to receive their regular updates automatically via email.