Economic outlook and forecasts SALT deductions set to lift Northeast and West spending

March 2026 – Tax season is in full swing and significant changes to the tax code from the One Big Beautiful Bill Act (OBBBA) are set to boost refunds for many taxpayers this year. The OBBBA was passed in July 2025, but it is retroactive in that the changes cover all of 2025 income and taxes paid. The biggest change to the bill is the significant increase in the cap on state and local taxes (SALT) from $10,000 dollars to $40,000 dollars. This change has significant implications for consumer income and spending that we expect will play out very differently across different states.
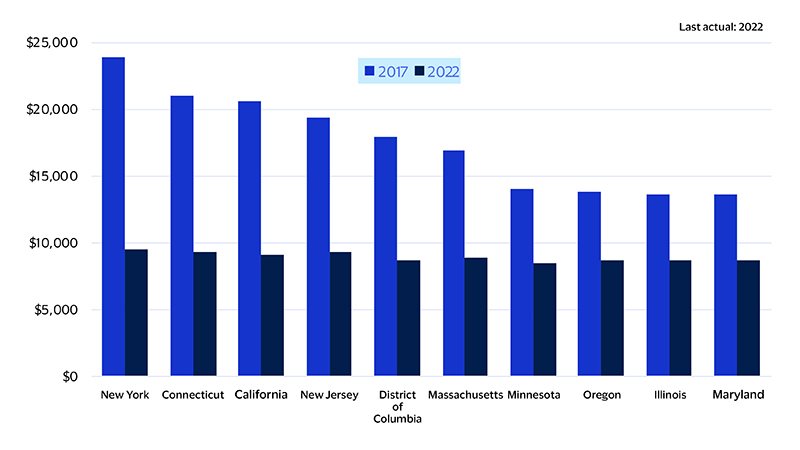
While the ultimate impact across states remains uncertain, a comparison of 2017—the last year before the SALT deduction cap was implemented—to 2022 (the most recent year with available tax data) indicates the average deduction is likely to increase the most in higher-tax states, which are largely concentrated in the Northeast and West. As a result, we expect a significant lift in income for the Northeast and West in the first half of 2026.
The substantial rise in income resulting from this tax policy change is likely to have an immediate effect on consumer spending growth, with the strongest gains in those regions. We anticipate that higher consumer spending will, in turn, boost both employment and real gross domestic product (GDP) in these regions during the first half of 2026. As a result, we expect the Northwest and West to lead the nation in GDP, consumer spending and employment growth through the first half of this year.
Several states are set for large increases in tax refunds
Average SALT deduction claimed by state
2026 is poised to be a tale of two halves for the Northeast
Our forecasts indicate that the Northeast’s GDP growth outpaced all other regions in the U.S. in the final quarter of 2025, thanks to strong growth in regionally significant sectors like finance, healthcare, and professional and business services. The resilience of these sectors likely supported relatively robust job creation and consumer spending growth as well.
Looking to 2026, the Northeast economy is expected to be a tale of two halves, with the first half characterized by strong consumer spending growth following elevated tax refunds. Changes to the SALT deduction cap under the OBBBA are likely to disproportionately benefit high‑income households concentrated in New York, New Jersey, Massachusetts and Connecticut, improving after‑tax incomes and supporting consumer spending, job creation and economic growth.
However, the spending impact from higher tax refunds is likely to be limited to the first half of 2026. We anticipate economic and job growth to subside in the second half of 2026, due to a combination of aging demographics, elevated business costs and sector‑specific headwinds. Manufacturing, construction and certain professional services will likely continue to face pressure from tariffs, high interest rates and labor shortages.
Large states, such as New York, New Jersey and Massachusetts, will benefit from economies of scale, diversified economies and concentrations of healthcare, education and technology. However, each faces structural constraints. New York and New Jersey continue to experience net domestic out‑migration, while Massachusetts is contending with retrenchment in biotech, higher education and tech following the post‑pandemic boom. Pennsylvania stands out as a bright spot with diversified healthcare and energy sectors, though long‑term demographic trends still cap its growth potential.
Smaller New England states, such as Maine, Vermont and New Hampshire, are more exposed to demographic decline and sector concentration. Tourism softness, healthcare labor shortages and shrinking working‑age populations restrain growth, even as targeted investments in semiconductors, defense manufacturing and shipbuilding provide localized support.
Overall, the Northeast in 2026 will experience strong consumer spending in the first half, driven by an influx of refunds, followed by a second half where persistent structural challenges are set to limit economic growth.
Southern growth powers ahead in early 2026
We continue to forecast the South as one of the strongest‑growing regions in the U.S. Low costs of living have long supported strong population gains, and we expect this advantage to continue supporting growth, even as recently released data suggest some states are starting to see slower gains. As a result, population growth is likely to become more uneven across the region over the next few years.
Strong domestic migration has been a defining feature of the South in recent years, driven by cost of living and robust job creation. However, recent Census data indicate this trend may be moderating as more restrictive immigration policies take effect. States that previously saw large inflows—most notably Florida and Texas—have experienced a pullback in net international immigration. This slowdown is likely to weigh on regional growth and create localized, sector‑specific impacts, particularly in construction and hospitality. In contrast, other states, such as South Carolina, continue to post some of the strongest population gains in the country. Uneven population growth will temper job creation and spending in some states while supporting growth in others. While the South is still expected to attract new residents over the coming years, the region has likely passed its peak rate of population growth and is transitioning to a more sustainable expansion.
Economic growth should receive a modest boost in the first half of 2026 as tax cuts from the OBBBA support both consumers and businesses, though the benefits will be unevenly distributed. Given the higher state and local taxes paid in Washington, D.C. and Virginia, many residents there are poised to see larger federal tax refunds than those in Southern states that do not tax income. Businesses, however, stand to benefit more broadly in the region, particularly through provisions allowing full deductions for heavy capital investment.
The greatest downside risks for the South continue to be concentrated in D.C., Virginia and Maryland, particularly in areas with significant exposure to the federal government. The civilian federal workforce is at its lowest level in 50 years, as workforce reductions continue and deferred resignations roll off payrolls. These cuts will have downstream effects on housing, professional services and government contracting.
Overall, the South has benefited significantly from strong population growth, which has driven economic expansion, consumer spending and job creation. While we continue to forecast solid growth, the region is likely to experience a gradual moderation in the latter half of 2026 due to restrictive immigration policies and a maturing migration cycle.
Pockets of strength not enough to offset structural headwinds
The Midwest economy continued to trail the nation and all other regions in the third quarter of 2025 on a year-over-year basis, with growth uneven across states and sectors. While pockets of strength have emerged—particularly in healthcare and advanced manufacturing—the region remains constrained by weak manufacturing demand, agricultural headwinds and adverse demographic trends.
Manufacturing remains the region’s primary drag. Core industrial states such as Michigan, Illinois and Wisconsin continue to lose factory jobs as high input costs, elevated borrowing rates and persistent trade uncertainty weigh on orders and investment. Autos and machinery are especially exposed. Michigan faces compounded risks from softening vehicle demand and tariff-driven cost pressures, while Illinois and Wisconsin struggle with a subdued finance sector and trade disruptions, respectively. Even in relatively resilient states like Indiana and Ohio, near-term momentum is being driven more by healthcare and advanced manufacturing than by broad factory activity.
Agriculture adds further strain. While historically low herd counts are driving record beef prices for cattle ranchers, row crop producers in Iowa, Illinois and Nebraska remain vulnerable to volatile commodity prices, threatened export markets, rising fertilizer and equipment costs, and labor shortages tied to immigration constraints. The USDA expects more than $44 billion in farm program payments in 2026—a $14 billion increase from 2025—which will provide some relief.¹ Still, farm incomes remain under pressure, limiting spillover benefits to equipment manufacturing and rural services.
Minnesota is a bright spot, supported by healthcare expansion and high-tech manufacturing tied to medical devices and electronics. ² Indiana continues to benefit from large-scale investments in EV batteries and pharmaceuticals, including a $200 million biopharmaceutical expansion in Fishers expected to create 1,000 jobs by 2030.³ Ohio is also seeing strength from data centers, with roughly $40 billion in investment expected statewide through 2030.⁴
Looking ahead, slowing population growth—or decline in states such as Illinois—will cap long‑term growth. While metro areas like Chicago and Minneapolis may see modest boosts from expanded SALT-related tax refunds, the larger regional lift to consumer spending this year will come from expanded child tax credits and a higher standard deduction. Even so, the Midwest will likely continue underperforming the nation.
AI fuels growth but job gains lag
The West’s economy entered the second half of 2025 with stronger underlying momentum, leading the nation and all other regions except the Northeast in third-quarter economic growth. Looking ahead, we expect the West to outperform all regions in 2026.
California, the nation’s largest economy, is the epicenter of the AI boom and a leader in related investment, startup formation and talent. The surge in AI investment has lifted economic growth, but there are concerns it is crowding out investment elsewhere in the tech sector.⁵ Moreover, tech employment in the Golden State is essentially flat relative to pre‑pandemic levels, as AI reflects a restructuring of tech employment rather than a renaissance. As a result, we expect California to track near regional and national average growth while continuing to lag in job creation.
Washington shows a similar pattern: Employment growth is cooling, but economic output remains supported by AI‑related investment and trade‑linked services, even as tariffs cap the upside. The state’s aerospace sector is set to benefit from a $2.8 billion deal to modernize South Korea’s military aircraft over the next decade.⁶
Tourism‑dependent states face a mixed outlook. Nevada and Hawaii are experiencing slower leisure and hospitality hiring as travel demand softens, particularly from international visitors. Las Vegas attracted roughly 3 million fewer visitors last year—the largest decline outside the pandemic since the state began tracking visitors in 1970. ⁷ Hawaii also saw a notable slowdown during peak summer and holiday periods, even as visitor spending rose, suggesting a growing reliance on higher‑income travelers.⁸
The Mountain West remains a key growth engine. Arizona continues to benefit from large‑scale semiconductor and advanced manufacturing investment tied to federal incentives. Utah and Idaho are also outperforming, supported by lower costs, domestic migration and expanding technology and business services ecosystems.
In the near term, expanded SALT-related tax refunds will help boost consumer spending, especially in California, Oregon and Hawaii. Further out, the West’s trajectory will hinge on tech-hiring stabilization, migration into lower‑cost states and trade-policy evolution. While employment growth is likely to lag the nation through 2026, strong productivity, investment and consumer demand position the West to outperform the U.S. in economic growth in 2026.
Footnotes
- Visa Business and Economic Insights and U.S. Department of Agriculture
- Visa Business and Economic Insights and Minneapolis Saint Paul Regional Economic Development Partnership, Philips R&D and manufacturing expansion advances Minnesota MedTech leadership - Minneapolis Saint Paul Economic Development | Greater MSP
- Visa Business and Economic Insights and Thomasnet, Inside Indiana manufacturing: How the state became a U.S. industrial leader
- Visa Business and Economic Insights and the Ohio Statehouse News Bureau, Study: Ohio data centers have contributed $5.2 billion in tax revenue | The Statehouse News Bureau
- Visa Business and Economic Insights and The Washington Post, The AI boom is so huge it’s causing shortages elsewhere - The Washington Post
- Visa Business and Economic Insights and Yahoo Finance, Boeing secures a $2.81B contract to upgrade South Korea's F-15 fleet
- Visa Business and Economic Insights and USA Today, Las Vegas tourism has plummeted. Here's what it's like now.
- Visa Business and Economic Insights and SFGate, Hawaii’s small businesses on the brink as holiday tourism slows
Forward-Looking Statements
This report may contain forward-looking statements within the meaning of the U.S. Private Securities Litigation Reform Act of 1995. These statements are generally identified by words such as “outlook,” “forecast,” “projected,” “could,” “expects,” “will” and other similar expressions. Examples of such forward-looking statements include, but are not limited to, statements we make about Visa’s business, economic outlooks, population expansion and analyses. All statements other than statements of historical fact could be forward-looking statements, which speak only as of the date they are made, are not guarantees of future performance and are subject to certain risks, uncertainties and other factors, many of which are beyond our control and are difficult to predict. We describe risks and uncertainties that could cause actual results to differ materially from those expressed in, or implied by, any of these forward-looking statements in our filings with the SEC. Except as required by law, we do not intend to update or revise any forward-looking statements as a result of new information, future events or otherwise.
Disclaimers
The views, opinions, and/or estimates, as the case may be (“views”), expressed herein are those of the Visa Business and Economic Insights team and do not necessarily reflect those of Visa executive management or other Visa employees and affiliates. This presentation and content, including estimated economic forecasts, statistics, and indexes are intended for informational purposes only and should not be relied upon for operational, marketing, legal, technical, tax, financial or other advice and do not in any way reflect actual or forecasted Visa operational or financial performance. Visa neither makes any warranty or representation as to the completeness or accuracy of the views contained herein, nor assumes any liability or responsibility that may result from reliance on such views. These views are often based on current market conditions and are subject to change without notice.
Visa’s team of economists provide business and economic insights with up-to-date analysis on the latest trends in consumer spending and payments. Sign up today to receive their regular updates automatically via email.