Overall wealth effect
The sudden increase in the wealth effect and its impact on spending
U.S. Economic Insight

June 2023 – Wealth has a prominent influence on consumer spending, and its impact is only getting larger. According to new analysis from Visa Business and Economic Insights, the wealth effect has almost quadrupled in the last few years, positioning wealth as a crucial driver of consumer activity. There is a wide body of research on the wealth effect, with most studies concluding that consumers spend between 4 percent and 15 percent of newfound wealth.1 According to our estimates, the wealth effect between 2002 and 2017 was 9 percent. Said another way, for every $1 increase in household wealth, consumer spending increased by 9 cents. Over the last few years, however, something changed dramatically. Using data through the third quarter of 2022, we find that the wealth effect has increased to 34 cents, almost quadruple the pre-pandemic average. For wealth held in stocks, bonds, and pension entitlements, the spending responsiveness was 24 cents. For wealth held in owner-occupied housing, it was 20 cents.
Wealth effects (cents per dollar change in household worth)
9 cents |
34 cents |
|
Housing stock effect |
4 cents |
20 cents |
Stock/bond wealth effect |
9 cents |
24 cents |
Why did the wealth effect increase so quickly? Because household wealth has exploded, consumer responsiveness to wealth-based news has accelerated, and the number of retirees has expanded at the fastest rate on record. Changes in the wealth effect have significant implications for merchants. First, wealth effects can heavily influence certain spending categories, with some highly sensitive to changes in stock and bond wealth or housing wealth. Both play a big role in spending behavior. Second, who is acquiring wealth and how their consumption changes with wealth accumulation are additional factors. While baby boomers have the highest share of U.S. net worth today, that will begin to change over the next decade as more wealth is transferred to millennial and Gen X consumers, whose spending habits will mature as they enter their peak spending years—buying homes and spending more on their children, travel, dining out, and general entertainment. For certain firms, wealth plays an exceptionally large role in business outcomes, with clear long-term repercussions through the end of the decade.
Highlights:
The wealth effect in a nutshell
When consumers gain wealth, their spending typically increases. They often feel more confident in their personal financial situation, leading them to spend more of their income and put less into savings. This can occur when the market has helped them achieve their savings goals – for example, because the value of their stock and bond holdings has increased – allowing them to purchase more goods and services today while maintaining confidence in their future financial situation.
On other occasions, when wealth increases, consumers borrow against their assets to fund current consumption. When home prices go up, homeowners often tap home equity lines of credit (HELOCs) to take a vacation or remodel the kitchen. These purchases contribute towards broad-based consumer spending, resulting in added revenue for a variety of industries.
In yet another example of the wealth effect, individuals often liquidate assets to fund current consumption. This most commonly occurs among retirees, who typically sell stocks or downsize their homes, using the proceeds to supplement their reduced incomes. As the population has aged and the number of retirees has grown, this portion of the wealth effect has become increasingly impactful.
Lastly, the wealth effect influences virtually all consumers, even if they don’t have substantial net worth valuations. News is available at almost all times of day. It comes from a variety of sources, and it reaches millions of consumers nationwide.² When the stock market has a good week, or when the housing market is in a slump, a surprisingly large share of the population becomes aware in short order. This phenomenon is often called the “Evening News Effect,” but with the proliferation of news and finance apps giving most people an on-the-go stock ticker, a more appropriate moniker might be the “Smartphone Effect.” As shown in the figure below, stock market outcomes are highly correlated with consumer expectations for the economy.
Due to these factors, the wealth effect is a meaningful contributor to consumer spending, often accounting for a surprisingly large share.
Wilshire 5000 performance is correlated with Conference Board Consumer Expectations
(YoY percent change, 3MMA*)
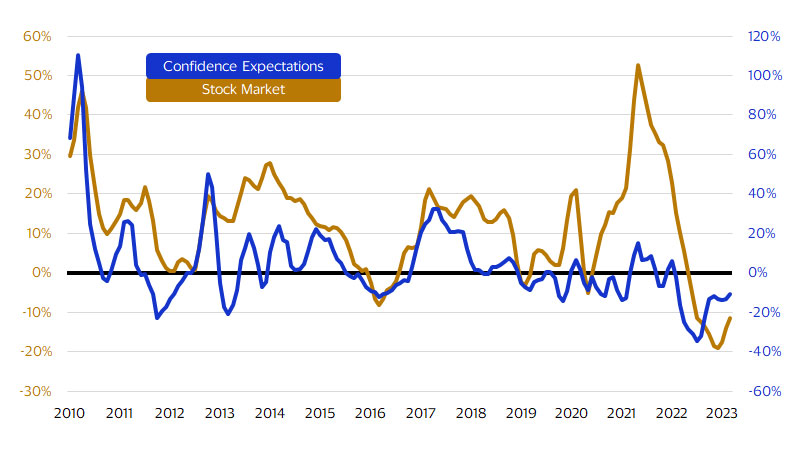
*3MMA=3-month moving average
Wealth accumulation pre- vs. post-pandemic
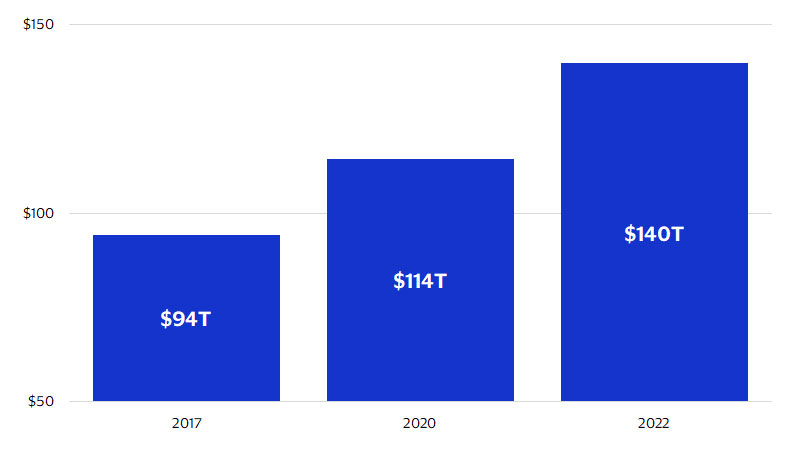
Between 2002 and 2017, household net worth expanded at an annual average rate of 5.3 percent, approximately doubling during this interval and reaching the eye-popping figure of $94 trillion.³ Then the wealth accumulation process sped up. Between 2017 and 2022, household net worth grew at an annual average rate of 8.2 percent, reaching $140 trillion. This was an impressive run that was only rivaled by the 2004-2005 housing bubble and the 1998-2000 “dot com” bubble.
Wealth has increased dramatically in recent years
(Household net worth, $ trillions. Last actual: 2022)
The implications of the 2017-2022 wealth building process are clear: the average household gained a lot of wealth over a short interval, planting the seeds for a new approach to spending. Alongside the wealth accumulation process, the proliferation of financial news – and most news in general – has progressed in almost unrelenting fashion. Internet news has been around for more than two decades, but the smartphone era began in earnest in 2007, when smartphones started transitioning from work-focused productivity tools to unquestioned necessities of everyday life. As of 2011, when personal smartphone adoption was in its infancy, 35 percent of Americans owned a smartphone. By 2018, that share had more than doubled to 77 percent, and by 2021 (the most recent data available), 85 percent of the population owned a smartphone.⁴
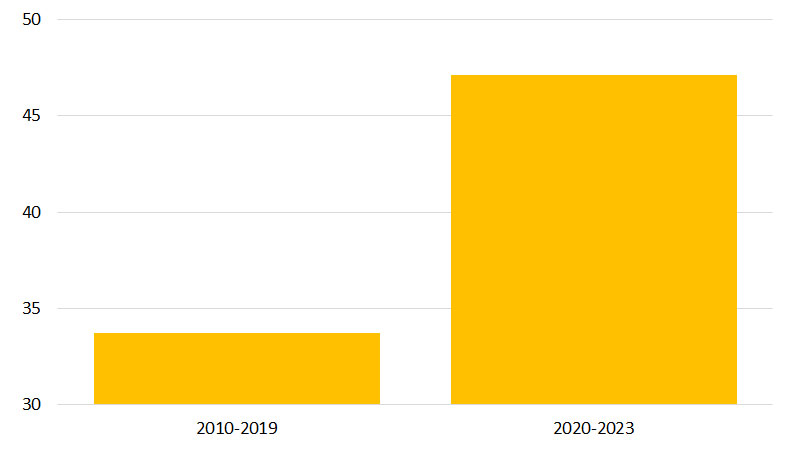
The personal smartphone era, combined with the expansion of the 24-hour news cycle, has had a clear and distinct impact on the availability of information about wealth. In 2018, internet searches for “stock market” and “dow jones” increased markedly, reaching higher peaks – and higher troughs – than any preceding period (see figure 4 of attached report).⁵ Similar trends can be seen with searches for “housing market” and “heloc,” the common acronym for a home equity line of credit (figure 5 of attached report.). All of this suggests that consumers have faster access to information about their own financial situation, making their spending choices more sensitive to fluctuations in asset markets. Our calculations suggest that market fluctuations impact the consumer psyche 13 percentage points faster in the 2020s compared to the 2010s.⁶
Velocity of consumer sentiment sensitivity to stock market changes
(Percentage points. Last actual: March 2023)
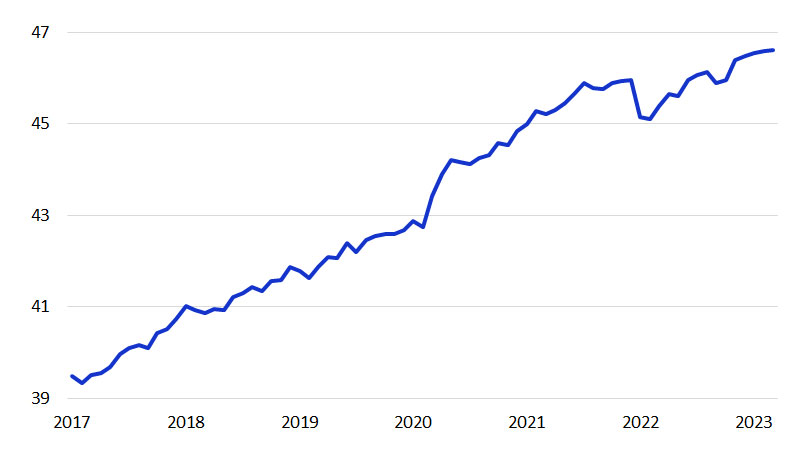
Over the last few years, the retiree population has expanded rapidly, likely contributing substantially to the wealth effect. Retired individuals represented 14 percent of the civilian non-institutional population in January 2002.⁷ Over the subsequent 15 years, the number of retirees increased by 10 million, growing at an average rate of 2.0 percent per year. Over the last five years, this cohort has grown much more quickly, expanding by 2.8 percent per year and reaching 18 percent of the population. Over this short, five-year interval, the number of retirees grew by a whopping 7.1 million people. When people retire, the composition of their income changes. They no longer receive income from work, instead relying on social security, income from their investments, support from relatives (often their children), and other sources. The net worth of the retirement cohort is also much larger than that of the pre-retirement groups,⁸ making retirees more reliant on changes in wealth than their younger counterparts.
Age 65+ not in the labor force
(Millions. Last actual: March 2023)
How does wealth impact spending?
Rather than being stable over time, the wealth effect varies substantially. Asset valuations and household net worth also vary, and the changes in these metrics can be used to estimate the wealth effect’s year-by-year contribution to consumer spending.
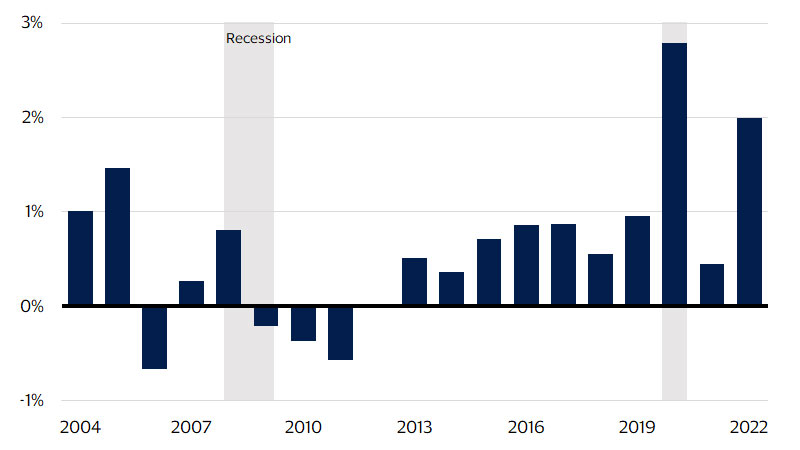
In the brief period before the 2007-2009 Global Financial Crisis, the housing wealth effect was responsible for approximately 1 percent of consumer spending.⁹ The housing bubble was inflating, consumers likely felt flush, and they probably spent more than they otherwise would have. After the bubble burst, home prices began to fall and aggregate housing wealth declined sharply. During this period, the housing wealth effect detracted from broad-based consumer spending by approximately 0.5 percent. This was followed by a long and stable stretch of moderately positive additions to spending. When the pandemic era arrived, home prices and housing wealth exploded, and the housing wealth effect accounted for upwards of 2 percent of consumer spending.
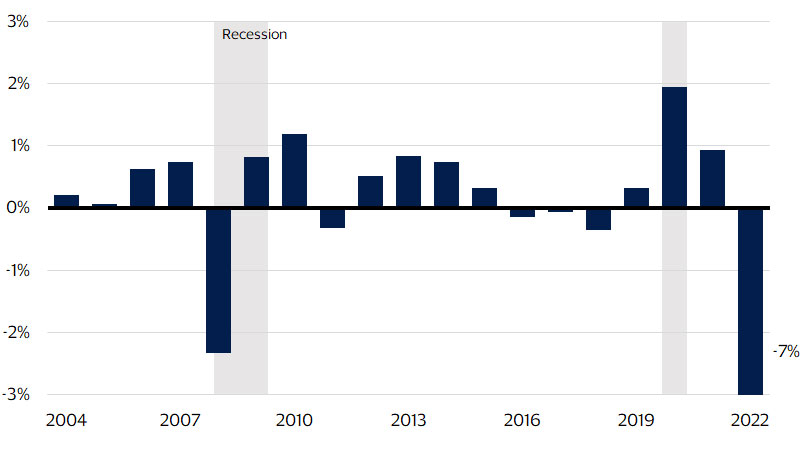
The stock/bond wealth effect typically adds to consumer spending, except during years when markets are flat or outright decline. This includes 2008, when the Wilshire 5000 index contracted by 15 percent and the stock/bond wealth effect led to 2.3 percent less consumer spending than would have otherwise occurred.¹⁰ Fast forward to 2020, when the wealth effect increased and aggregate stock/bond wealth expanded. During this year, stock/bond wealth contributed 2 percent to consumer spending. By 2022, when markets teetered under the weight of rising interest rates and lower corporate profit margins, the stock/bond wealth effect detracted from consumer spending by a whopping 7 percent.
Housing wealth contribution to real personal consumption expenditure growth
(Percentage points. Last actual: Q3-2022)
Stock and bond wealth contribution to real personal consumption expenditure growth
(Percentage points. Last actual: Q3-2022)
Wealth effects vary by spending category
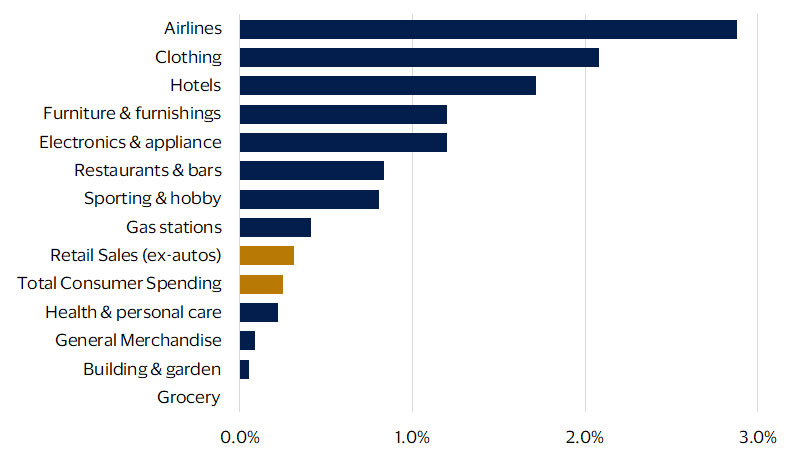
Just as wealth effects vary over time, their influences differ among spending categories. Changes in stock/bond wealth are particularly impactful for airlines and hotels.¹¹ During the COVID era, every 1 percent increase in stock/bond holdings led to a 2.9 percent gain in spending at airlines and a 1.7 percent rise in spending at hotels. Clothing stores, furniture and home furnishings stores, and electronics and appliance stores are also heavily impacted. In each of these categories, the recent wealth effects are exceptionally large. Grocery stores, building and garden equipment, and general merchandise stores are less sensitive to changes in stock and bond wealth.
Wealth effects are measured through regression analysis, and recent changes in wealth occurred alongside the COVID lockdowns and re-openings, which had a disproportionate impact on spending related to travel, clothing, furniture and furnishings, and household appliances. Therefore, it is likely that the unique COVID environment contributed to the estimation of these wealth effects.
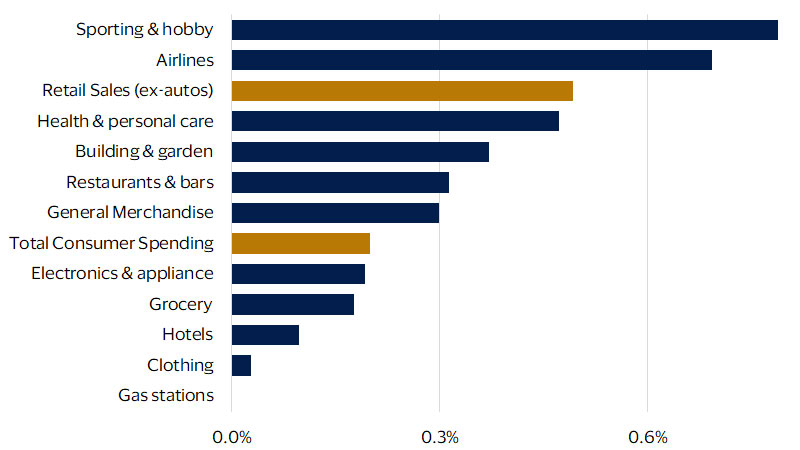
Changes in housing wealth are most impactful for sporting goods stores, hobby stores, and airlines.¹² In each category, a 1 percent increase in housing wealth increases spending by approximately 0.7 percent to 0.8 percent. With an elasticity of approximately 0.3 percent, restaurants, bars, and general merchandise stores are moderately responsive to housing wealth. Gas stations are unresponsive to the housing market, as gas consumption is fairly inelastic.
Stock and bond wealth effect by category
(Change in spending per 1% change in wealth. Last actual: Q3-2022)
Housing wealth effect by category
(Change in spending per 1% change in wealth. Last actual: Q3-2022)
The future of wealth
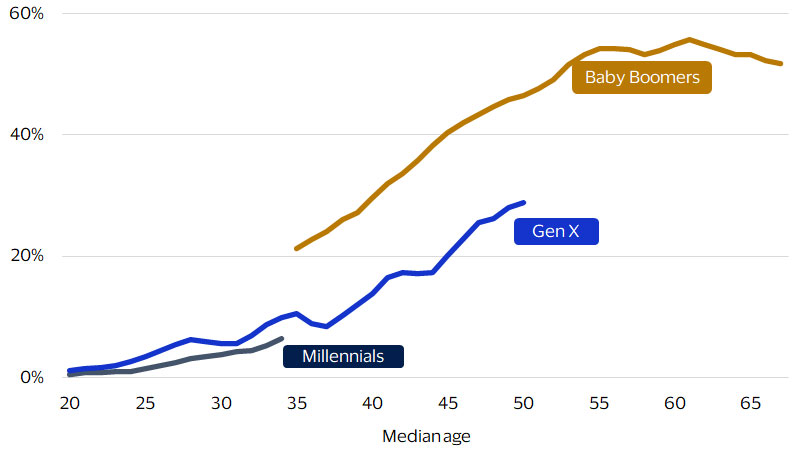
It’s a common misconception that the baby boomer generation acquired wealth easily, Generation X encountered difficulty but still gained a substantial amount of wealth, and the millennial generation has struggled mightily in its wealth accumulation journey. Taken at face value, the data seem to support this claim. When the median baby boomer was 35 years old, their generation held 21 percent of U.S. net worth.¹³ At the same age, Gen X held 11 percent and millennials held less than 8 percent. At virtually every age interval, boomers appear to hold more than their fair share, seemingly to the detriment of their younger counterparts.
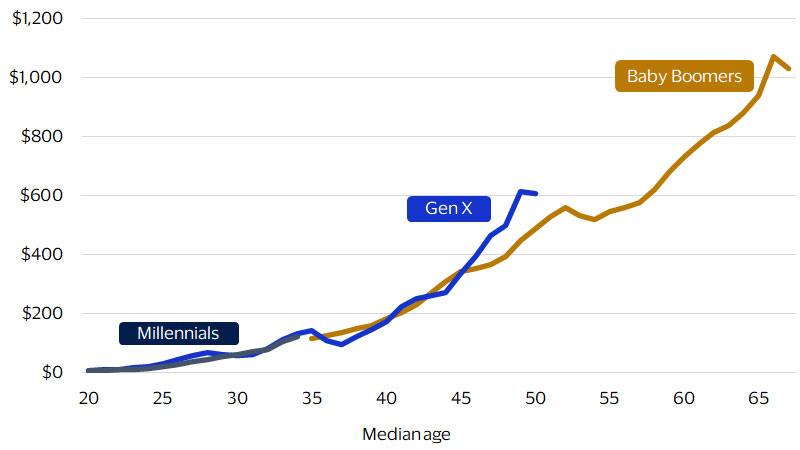
These data – and other similar statistics – have led to misconceptions about the challenges of millennials and the favorable financial situation of the baby boomers. But there’s a catch. When adjusted for inflation and population size, each generation has followed a surprisingly similar wealth accumulation path. By this measure, Gen X is actually ahead of the boomers. Why is this important? It shows the wealth effect is important for all generations, now and in the future.
Share of U.S. net worth by age
(Percent. Last actual: Q3-2022)
Real net worth per capita by age
(Thousands of dollars. Last actual: Q3-2022)
Going forward, household net worth is expected to increase substantially, particularly for millennials and Gen X. In 2022, these groups had a combined net worth of $49 trillion.¹⁴ If their wealth accumulation simply matches historical precedent, they would be expected to gain another $50 trillion in net worth by 2030. The “great wealth transfer,” which is expected to pass wealth from the boomers to their Gen X and millennial heirs, could add another $20 trillion on top.¹⁵ All told, millennials and Gen X could hold $119 trillion in net worth by 2030, more than double their current holdings.
The changing wealth position of millennials and Gen X has clear implications for merchants because spending habits are strongly influenced by age and life stage. In 2023, millennials are in the stage of life that is commonly associated with household formation. Many are buying homes and starting families, spending heavily on things like mortgage interest and infant accessories. By 2030, they will have moved into the mid-to-late career phase, which is typically associated with spending on airline fares and restaurant meals. Their wealth gains may augment these outlays, along with other expenditure categories. Gen X, by contrast, will approach the late-career and retirement stages by 2030, which are associated with higher spending on financial services, wine, and entertainment.
Peak spending categories by age
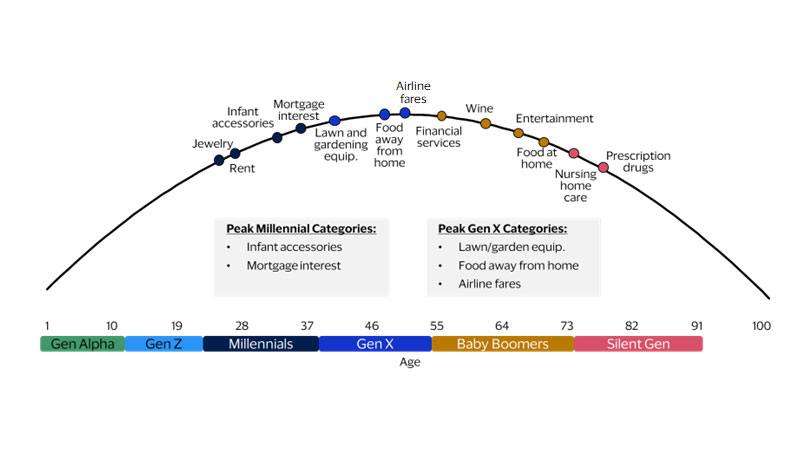
Combined, the millennial and Gen X cohorts will encircle the peak spending years between now and 2030 – which occur when people are in their 40s and 50s – and their huge expected increase in net worth will likely have a substantial impact on their consumption habits.
Footnotes
- ¹For example, see “Weighing the Wealth Effect” by Mark Zandi, Brian Poi, Scott Hoyt, and Wayne Best. https://www.moodysanalytics.com/landing/2018/wealth-effect
- ²According to Pew Research Center, 86 percent of adults consume news on a computer, smartphone, or tablet, which allow for real-time consumption. https://www.pewresearch.org/short-reads/2021/01/12/more-than-eight-in-ten-americans-get-news-from-digital-devices/
- ³ Visa Business and Economic Insights and Federal Reserve Board
- ⁴ Pew Research Center, Washington D.C., Mobile Fact Sheet, April 2021, https://www.pewresearch.org/internet/fact-sheet/mobile/#panel-7cfdecc4-bb29-4a14-96f5-5ba4acd5c1a9-data
- ⁵ Visa Business and Economic Insights and Google
- ⁶ Visa Business and Economic Insights, Wilshire, and University of Michigan
- ⁷ Visa Business and Economic Insights and U.S. Department of Labor
- ⁸ Visa Business and Economic Insights and Federal Reserve Board
- 9, 10, 11, 12 Visa Business and Economic Insights, Federal Reserve Board, and U.S. Department of Commerce
- ¹³Visa Business and Economic Insights, Federal Reserve Board, Pew Research Center and U.S. Department of Commerce
- ¹⁴ Visa Business and Economic Insights, Federal Reserve Board, and Pew Research Center
- ¹⁵ Visa Business and Economic Insights and Cerulli Associates
Forward Looking Statements
This report contains forward-looking statements within the meaning of the U.S. Private Securities Litigation Reform Act of 1995. These statements are generally identified by words such as “outlook,” “forecast,” “projected,” “could,” “expects,” “will” and other similar expressions. Examples of such forward-looking statements include, but are not limited to, statements we make about Visa’s business, economic outlooks, population expansion and analyses. All statements other than statements of historical fact could be forward-looking statements, which speak only as of the date they are made, are not guarantees of future performance and are subject to certain risks, uncertainties and other factors, many of which are beyond our control and are difficult to predict. We describe risks and uncertainties that could cause actual results to differ materially from those expressed in, or implied by, any of these forward-looking statements in our filings with the SEC. Except as required by law, we do not intend to update or revise any forward-looking statements as a result of new information, future events or otherwise.
Disclaimer
The views, opinions, and/or estimates, as the case may be (“views”), expressed herein are those of the Visa Business and Economic Insights team and do not necessarily reflect those of Visa executive management or other Visa employees and affiliates. This presentation and content, including estimated economic forecasts, statistics, and indexes are intended for informational purposes only and should not be relied upon for operational, marketing, legal, technical, tax, financial or other advice and do not in any way reflect actual or forecasted Visa operational or financial performance. Visa neither makes any warranty or representation as to the completeness or accuracy of the views contained herein, nor assumes any liability or responsibility that may result from reliance on such views. These views are often based on current market conditions and are subject to change without notice.
Visa’s team of economists provide business and economic insights with up-to-date analysis on the latest trends in consumer spending and payments. Sign up today to receive their regular updates automatically via email.