From game over to game on: The rise of the video gamer economy

April 2024 – Video gamers are emerging as an attractive, lucrative consumer segment and a force to be reckoned with globally. Analysis of anonymized VisaNet transaction data shows that video gamers* consistently punch above their weight in terms of overall spending and transaction frequency across all purchasing categories, not just at digital merchants. As the most digitally active cohort, video gamers generally outperform other cardholders in online spending metrics and tend to spend more overall. Visa Business and Economic Insights (VBEI) economists uncovered this trend, along with a set of behaviors common among video gamers, across diverse markets at different stages of digital maturity, highlighting video gamers’ growing prominence.
The confluence of major economic, technological and social forces will likely amplify the prominence of video gamers. At the end of 2023, the global games market generated an estimated $184 billion USD in global revenues, a figure that by 2026 is expected to reach $205 billion—close to the value of a mid-sized European economy such as Hungary.¹ Meanwhile, the number of video game players is expected to reach 3.8 billion by 2026, accounting for almost half of the world’s population.² A number of rapidly developing trends will only reinforce the burgeoning video gamer economy, including the rise of the middle class— especially in more populous emerging markets (e.g., India, China, Brazil). The increasing affordability of more leisure time and the seismic rise in the digital economy will also play a role, as will the proliferation of high-speed internet, advancements in mobile technology and the shift towards remote work.³
* For purposes of this report, we define a video gamer as a cardholder who made at least one online transaction in the “digital goods games” or “video amusement game supply” categories in the preceding three months.
Game on, wallet ready!
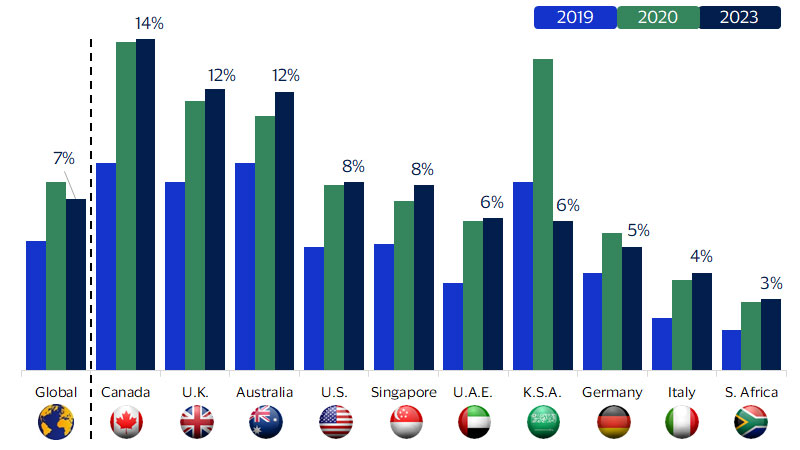
Share of video gamers rose post-COVID and remains sticky
Percent of cardholders identified as video gamers, annual average
Today’s video games are a vast universe, extending far beyond traditional exclusive gaming consoles and spanning a broader selection of platforms, including PC, mobile, and streaming services. They cover a wide, ever-expanding array of genres from e-sports to horror, fantasy, combat, strategy and beyond. Contrary to some popular stereotypes, the video gamer demographic isn't limited to younger males. In fact, the global gamer market is fairly evenly mixed between males and females.⁵ As for age representation, video gamers run the gamut in the U.S., with 38 percent falling between the ages of 18-34, 26 percent between 35-54, and 21 percent under 18, illustrating the wide appeal of video games.⁶
Since 2019, the number of active video gamers has risen across all key markets examined. For our analysis, we defined video gamers as cardholders who made at least one transaction in the preceding three months on online gaming platforms and merchants. As not all consumers who play video games make regular purchases on video gaming platforms, this methodology most likely underestimates the true number of video gamers. Nonetheless, the steady increase in the share of active cards regularly used on online gaming platforms is telling. Canada’s share was the highest among the key markets at 14 percent in 2023, and South Africa was the lowest at 3 percent. Interestingly, compared to 2019, the share of active video gamers rose in most markets studied, highlighting the stickiness of this change in behavior.
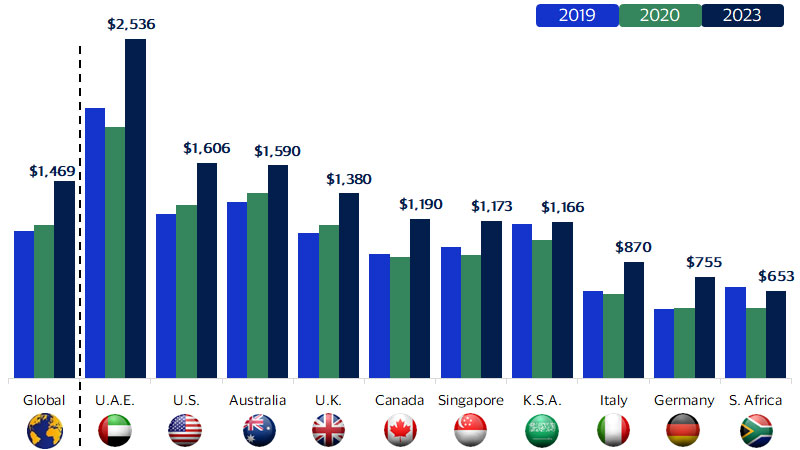
Our analysis also revealed that video gamers’ average total monthly card spending—in all categories, not only gaming—has risen in parallel with the share of cards used on online gaming platforms. Compared to 2019, video gamer cardholders increased their spending by an average of 21 percent across most of the markets examined. For example, in the U.A.E., the average total spending on a card regularly used on online video gaming platforms jumped from an average of $2,014 USD per month in 2019 to $2,536 USD in 2023 (see figure below).
Video gamers’ total spending has risen steadily and remains on an upward trajectory
Average monthly total spending by video gamer cardholders, including gaming and non-gaming purchases
Video gamers are a lucrative consumer segment
Ratio of average total monthly spending on video gamer cards vs. non-video gamer cards in 2023, by country
E-commerce and video games: Just click, pay and play
In online shopping and e-commerce, video gamer cards clearly outperform non-video gamer cards. Across all markets, average monthly e-commerce spending on video gamer cards is often a multiple of non-video gamer cards. On average, video gamers in the U.A.E. spend 1.7 times more than regular consumers on online or digital purchases, while the U.K. and Saudi Arabia see just over 1.2 times higher online spending on video gamer cards (refer to figure 4 in full report).
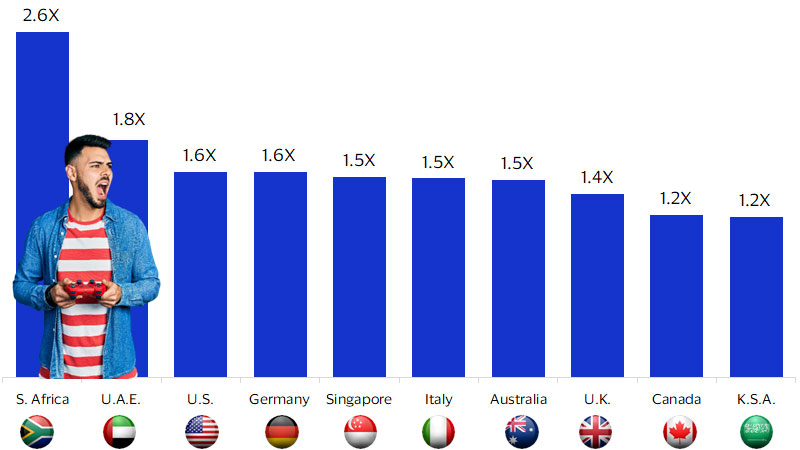
Not only do video gamers tend to spend more online and have higher ticket sizes than other consumers, but they also make more frequent purchases online and on e-commerce platforms. In all countries examined, video gamer cardholders made roughly twice as many transactions online as other cardholders, with country multiples ranging from 1.85 to 2.25 (see figure below).
Video gamers make more frequent online transactions
Ratio of the average number of online transactions on video gamer cards vs. non-video gamer cards in 2023, by country
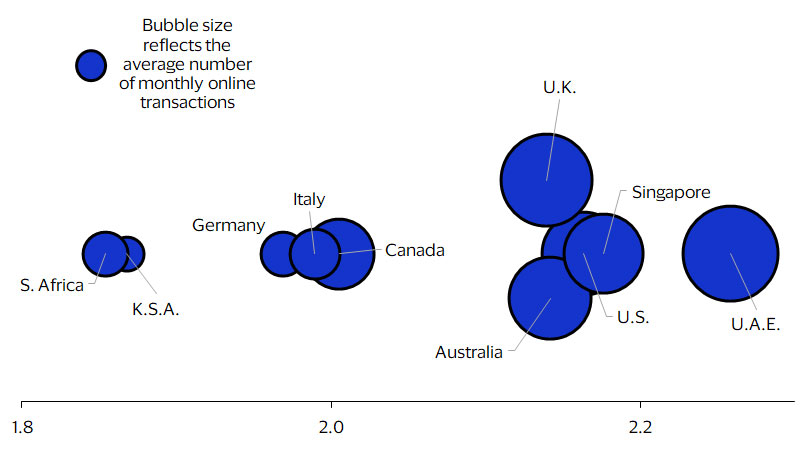
Economic growth equals more time for video games
Economic development and growth in personal income pave the way for more leisure time
Annual hours worked per capita vs. GDP per capita in USD in 2019
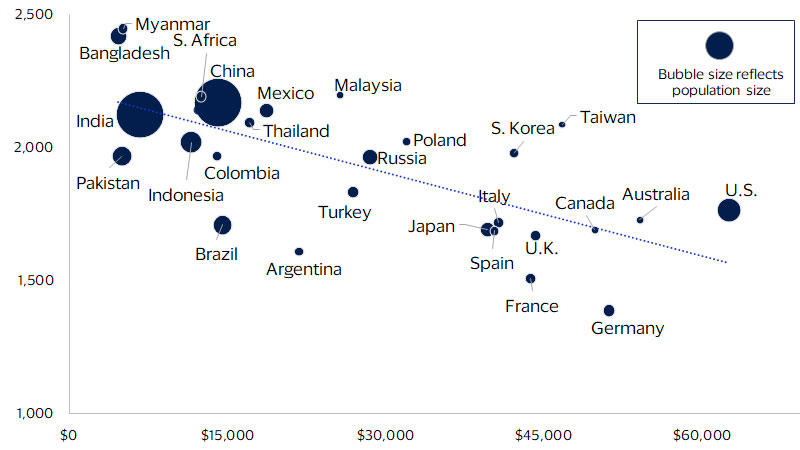
We expect that this decade will feature strong economic growth and, as a result, more leisure time. For billions of consumers around the world, this means more time to play video games. The number of video gamers surged from just under 2 billion in 2015 to approximately 3.2 billion in 2022 and is projected to reach 3.8 billion by 2026.⁹ As their numbers continue to grow, video gamers will become an increasingly valuable demographic for issuers and merchants. Additionally, the video game industry is likely to continue to expand to meet the demand, providing new opportunities for entertainment, social interaction, and even employment.
Contrary to the common belief that gamers are mostly kids, research shows it is an eclectic and inclusive demographic segment with significant economic and business impact. It's crucial for both issuers and merchants to recognize and capitalize on this influential consumer segment.
Footnotes
- Newzoo. (2024). Newzoo’s year in review: the 2023 global games market in numbers. https://newzoo.com/resources/blog/video-games-in-2023-the-year-in-numbers
- Newzoo. (2024). Newzoo’s year in review: the 2023 global games market in numbers. https://newzoo.com/resources/blog/video-games-in-2023-the-year-in-numbers
- Visa Business and Economic Insights. (2023). Weekends are the new weekdays for restaurants, as remote work alters traffic to urban centers. Retrieved from https://usa.visa.com/partner-with-us/visa-consulting-analytics/economic-insights/remote-work-alters-restaurant-traffic.html
- Aksoy, C. G., Barrero, J. M., Bloom, N., Davis, S. J., Dolls, M., & Zarate, P. (2023). Time Savings When Working from Home (No. w30866). National Bureau of Economic Research. Retrieved from http://www.nber.org/papers/w30866
- Dataprot. (2024). Gamer Demographics: Facts and Stats About the Most Popular Hobby in the World. Retrieved from https://dataprot.net/statistics/gamer-demographics/
- Entertainment Software Association. (2020). Essential Facts About the Video Game Industry. Retrieved from https://www.theesa.com/resource/2022-essential-facts-about-the-video-game-industry/
- Qustodio. (2022). From Alpha to Z: Raising the Digital Generations - Gaming Apps. Retrieved from https://www.qustodio.com/en/from-alpha-to-z-raising-the-digital-generations/gaming-apps/
- OECD. (2024). Average annual hours actually worked per worker. OECD.Stat. https://stats.oecd.org/index.aspx?DataSetCode=ANHRS
- Newzoo. (2024). The Games Market Will Show Strong Resilience in 2022, Growing by 2.1% to Reach $196.8 Billion. https://newzoo.com/resources/blog/the-games-market-will-show-strong-resilence-in-2022
Forward-Looking Statements
This report may contain forward-looking statements within the meaning of the U.S. Private Securities Litigation Reform Act of 1995. These statements are generally identified by words such as “outlook”, “forecast”, “projected”, “could”, “expects”, “will” and other similar expressions. Examples of such forward-looking statements include, but are not limited to, statements we make about Visa’s business, economic outlooks, population expansion and analyses. All statements other than statements of historical fact could be forward-looking statements, which speak only as of the date they are made, are not guarantees of future performance and are subject to certain risks, uncertainties and other factors, many of which are beyond our control and are difficult to predict. We describe risks and uncertainties that could cause actual results to differ materially from those expressed in, or implied by, any of these forward-looking statements in our filings with the SEC. Except as required by law, we do not intend to update or revise any forward-looking statements as a result of new information, future events or otherwise.
Disclaimers
The views, opinions, and/or estimates, as the case may be (“views”), expressed herein are those of the Visa Business and Economic Insights team and do not necessarily reflect those of Visa executive management or other Visa employees and affiliates. This presentation and content, including estimated economic forecasts, statistics, and indexes are intended for informational purposes only and should not be relied upon for operational, marketing, legal, technical, tax, financial or other advice and do not in any way reflect actual or forecasted Visa operational or financial performance. Visa neither makes any warranty or representation as to the completeness or accuracy of the views contained herein, nor assumes any liability or responsibility that may result from reliance on such views. These views are often based on current market conditions and are subject to change without notice.
Visa’s team of economists provide business and economic insights with up-to-date analysis on the latest trends in consumer spending and payments. Sign up today to receive their regular updates automatically via email.