What is Visa Click to Pay?
It's Visa's implementation of EMVco's industry-wide standards and specifications that will create a fast, frictionless shopping experience.
Online shopping. Simplified
Easy
Enrolled customers no longer have to enter account numbers, look up passwords or fill out long forms to make a purchase.

Smart
Fast, simple digital checkouts reduce friction, which can help to lower cart abandonment and increase conversions.

Secure
Visa uses multiple layers of payment security to protect sensitive customer and transaction information. With Visa, your customers can buy with confidence.
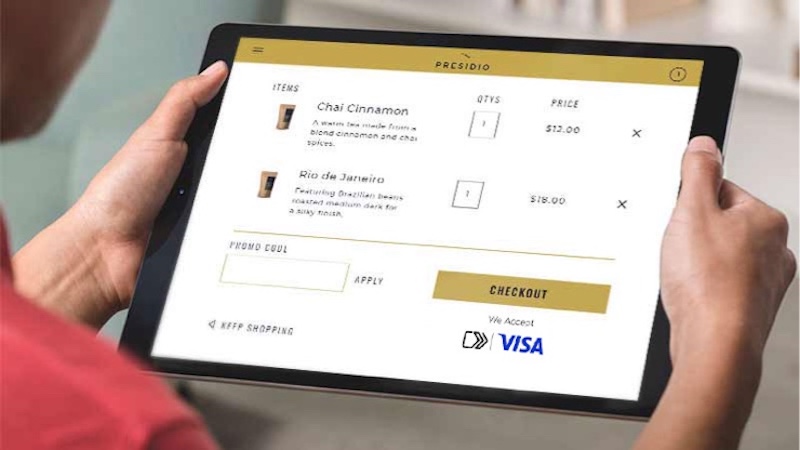
Visa Click to Pay. Built to handle ecommerce’s biggest challenges
Online shopping isn’t frictionless. And that’s why adding an evolved guest checkout experience is so important.
Sources:
1 2020 VisaNet Global Data
2 eCommerce Fraud Trends 2019, Merchant Fraud Journal, https://www.merchantfraudjournal.com/ecommerce-fraud-trends-2019/
3 Forbes, Why Cart Abandonment Rates Aren’t Falling, 2018, https://www.forbes.com/sites/paultalbot/2018/06/27/why-cart-abandonment-rates-arent-falling/#7f1bfd7f7bb6
The EMV® SRC payment icon, is a trademark owned by and used with permission of EMVCo, LLC.
EMV® is a registered trademark in the U.S. and other countries and an unregistered trademark elsewhere. The EMV trademark is owned by EMVCo, LLC.
Have further questions?
Read our FAQ about the new way to checkout online with a Visa card.